
零基础——用 AI Agent 画生存分析曲线(survival-curve) | 全程复制粘贴
本教程以 workbuddy 作为 AI agent、Hy3 作为 AI API 为例。AI agent 本身的安装与配置请看AI Agent 安装教程。
在开始之前(必读):
- 如果你是第一次用 AI agent 做数据分析,强烈建议先跟一遍 bulk-RNA-seq 差异分析教程,熟悉"装技能 → 配环境 → 跑示例 → 换自己数据"的完整流程,再回来做本技能。
- 本技能是独立技能,不依赖任何其他技能的输出——给一张随访表就能跑。
- 一句话:随访表进,Kaplan-Meier 生存曲线 + 风险表 + 单因素 Cox 森林图出——自动 maxstat 最优截点,600 dpi 发表级 PNG + PDF。
- ⚠️ 方法学警示(必读):数据驱动截点(data-driven cutoff)会系统性高估组间差异(optimism bias)。论文中必须声明截点的确定方法,最好有独立队列验证;事件数过少(<10)时 Cox 结果不可靠,应只做 KM 或在报告中注明。
- 本技能是模板脚本(不是命令行工具):换数据只改脚本顶部的 CONFIG 块——Step 4 的 prompt 会让 AI 替你改,你不用动手。Windows 直接跑,不需要 WSL。
教程结构:
- Step 1|安装 survival-curve 技能(只需一次)
- Step 2|配置运行环境(只需一次)
- Step 3|跑通示例数据
- Step 4|换成你自己的数据
- Step 5|读懂结果与 REPORT.md
- 更多分析|相关技能简介(临床统计表 / 分组柱状图)
Step 1|Install the survival-curve skill
输入以下 prompt:
Please install the "survival-curve" skill for me, into the D:\claw2bio folder:
1. Create a folder named claw2bio in the root of the D: drive (if it doesn't exist yet).
2. From the GitHub repository https://github.com/nihuanhe/claw2bio, fetch ONLY the folder
   figure-generation/survival-curve (use sparse checkout — do NOT clone the whole repository),
   and place it at D:\claw2bio\survival-curve.
3. If downloading from GitHub fails or is too slow, download the zip from this mirror link instead:
   https://claw2bio.site/downloads/survival-curve.zip
   and extract it to D:\claw2bio\survival-curve.
4. Read the SKILL.md inside, then confirm to me that the skill is ready and list the contents
   of the folder.
(If my PC has no D: drive, install to C:\claw2bio instead and tell me the actual path.)
Step 1 完成后,打开文件管理器确认 D:\claw2bio\survival-curve 文件夹存在,里面有 scripts/、examples/、SKILL.md 等内容。
Step 2|Set up the runtime environment
如果你已经按 bulk-RNA-seq 教程装好了 R(4.5 或以上),这一步只需补装 4 个包。输入 prompt:
Please set up the runtime environment for the "survival-curve" skill at
D:\claw2bio\survival-curve:
1. R should already be installed from the bulk-RNA-seq tutorial — verify that R is installed
   and report its version to me (it must be 4.2 or above; 4.5+ recommended). If R is missing,
   stop and tell me.
2. Install all R packages this skill needs: survival, survminer (must be ≥0.5), readxl, dplyr —
   from CRAN. If any package fails or is too slow, stop and tell me about it.
3. IMPORTANT: do NOT downgrade survminer below 0.5 — older versions have a surv_categorize
   behavior that breaks the template (it returns a character column instead of a factor).
4. When everything is installed, confirm to me that the skill can run.
Step 3|跑通示例数据
输入 prompt:
The skill is installed at D:\claw2bio\survival-curve. Please run the bundled example:
1. Run the template script as-is: Rscript scripts/survival_curve_template.R — it auto-locates
   the example input.
2. Prefer the skill's own scripts in scripts/ — do NOT write new analysis code from scratch.
3. When the run succeeds, show me the KM curve and the Cox forest plot, and read me the
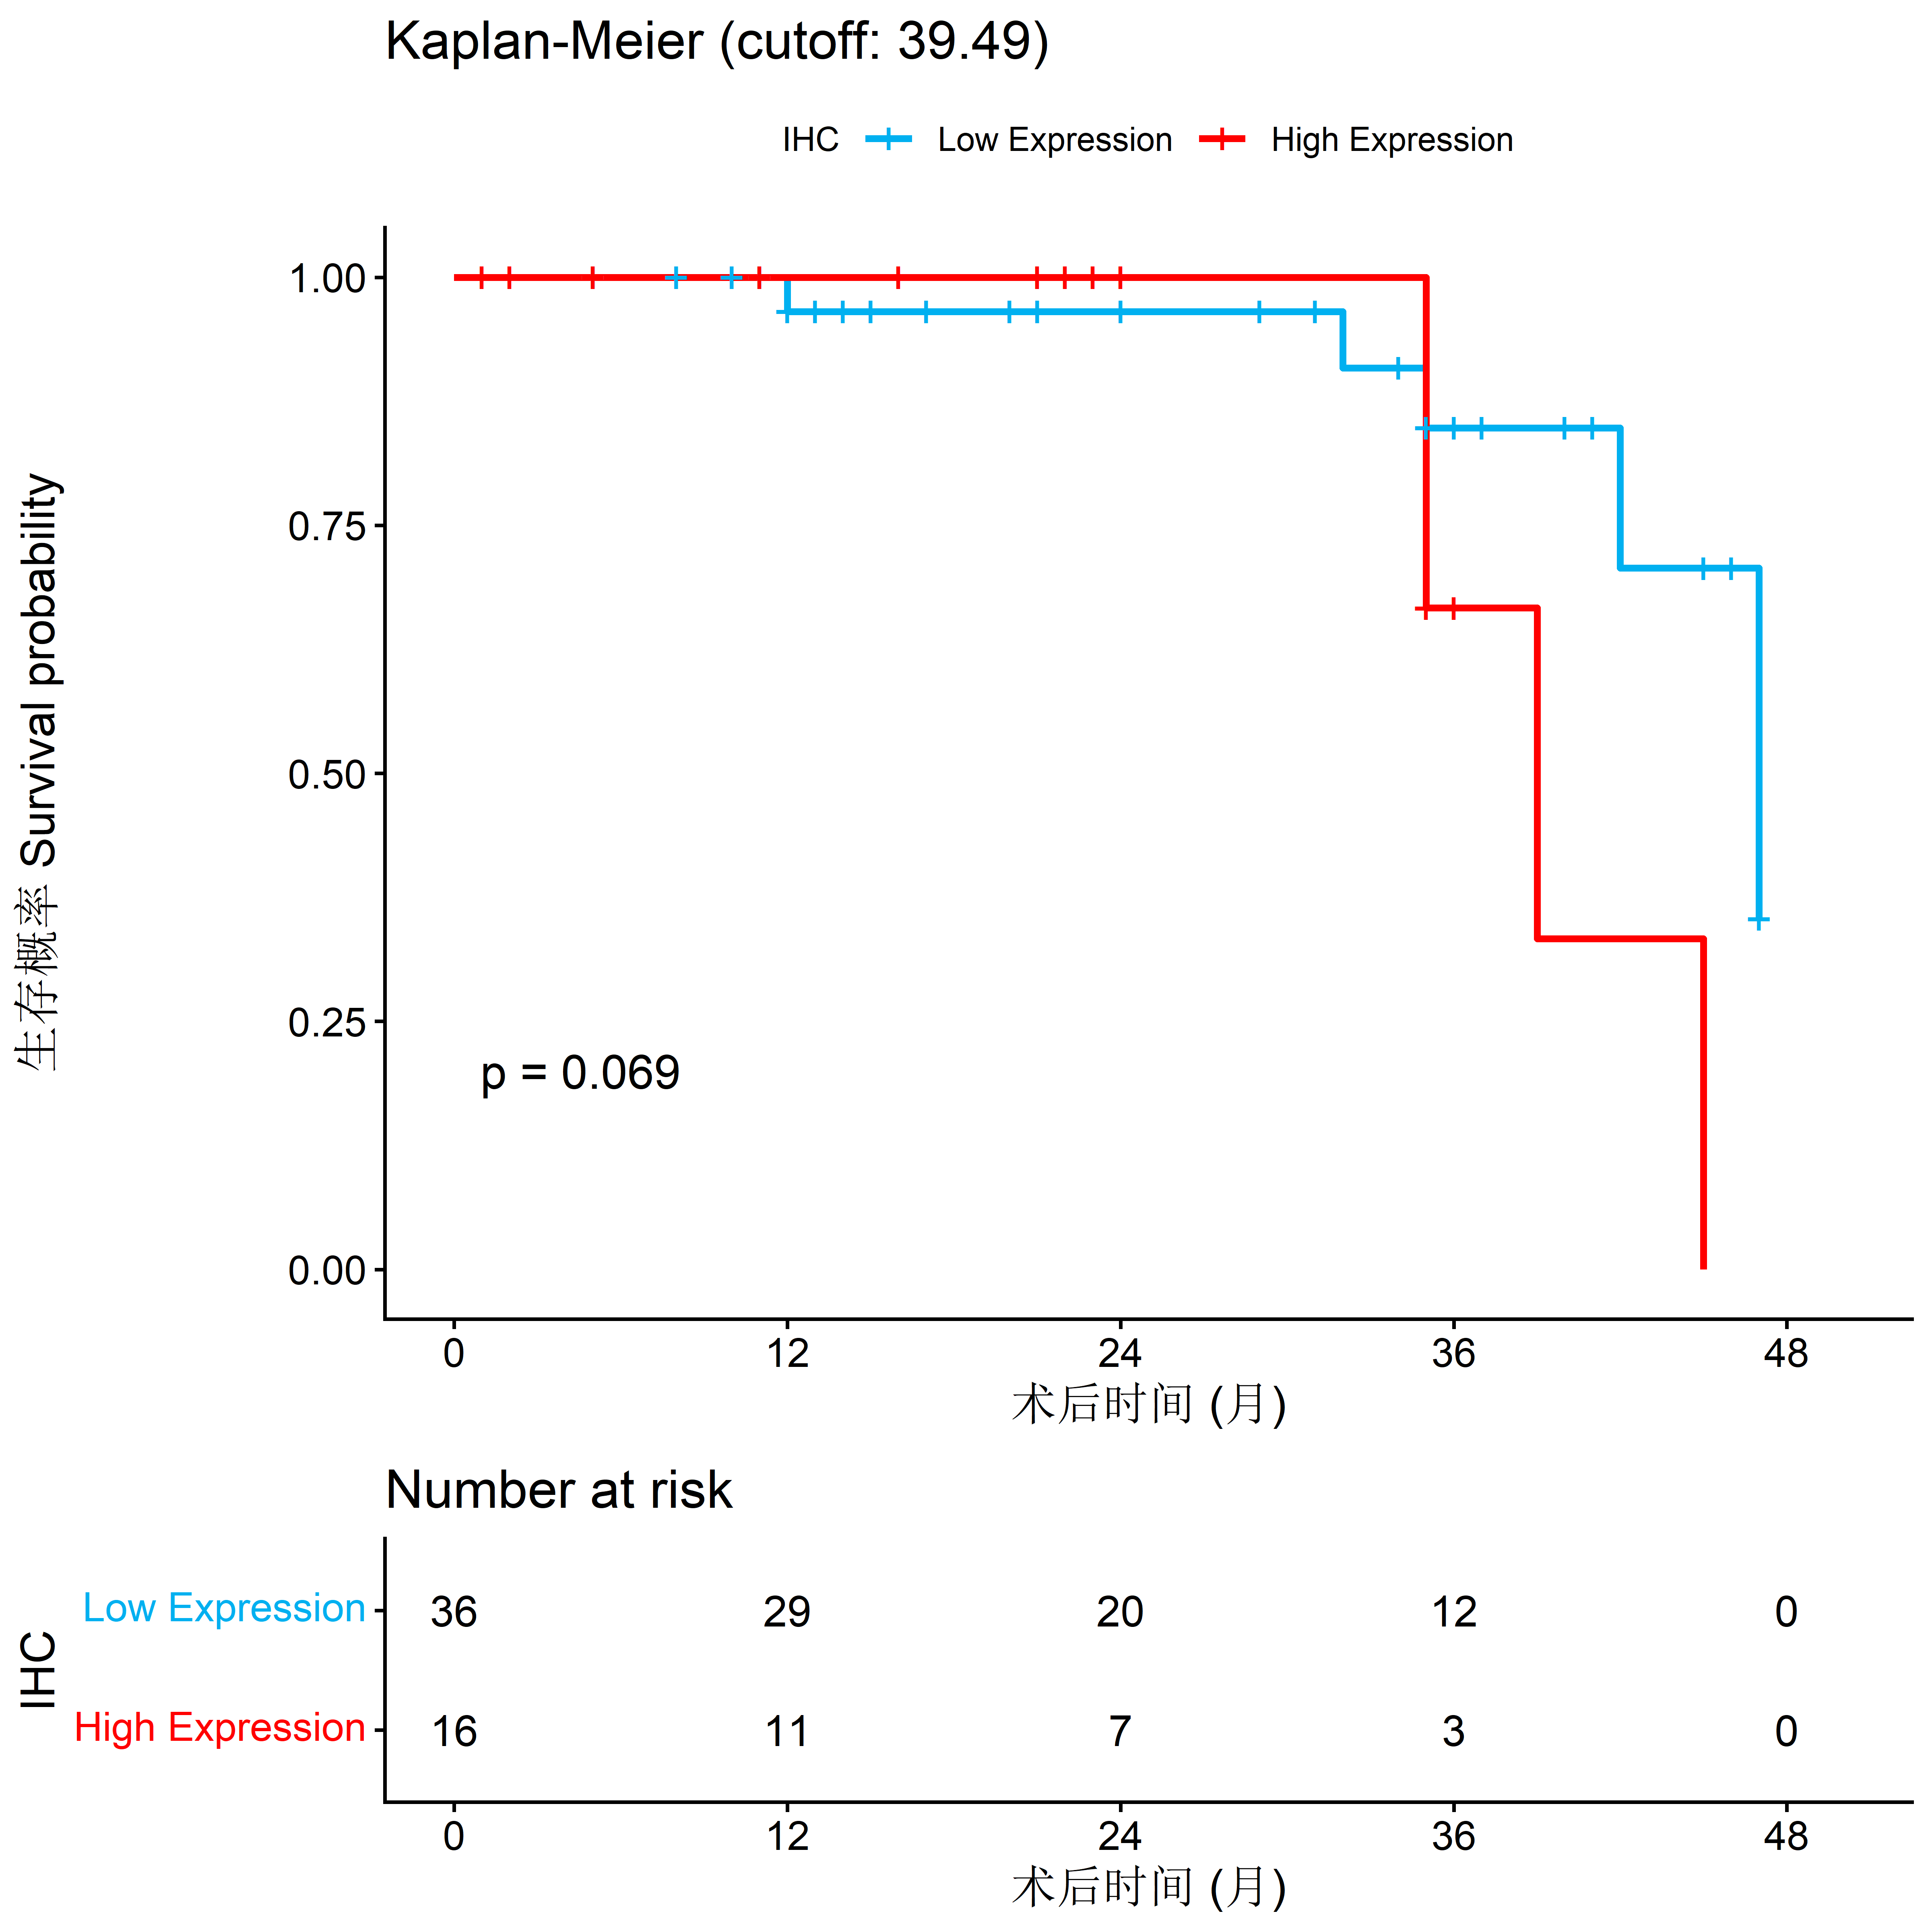
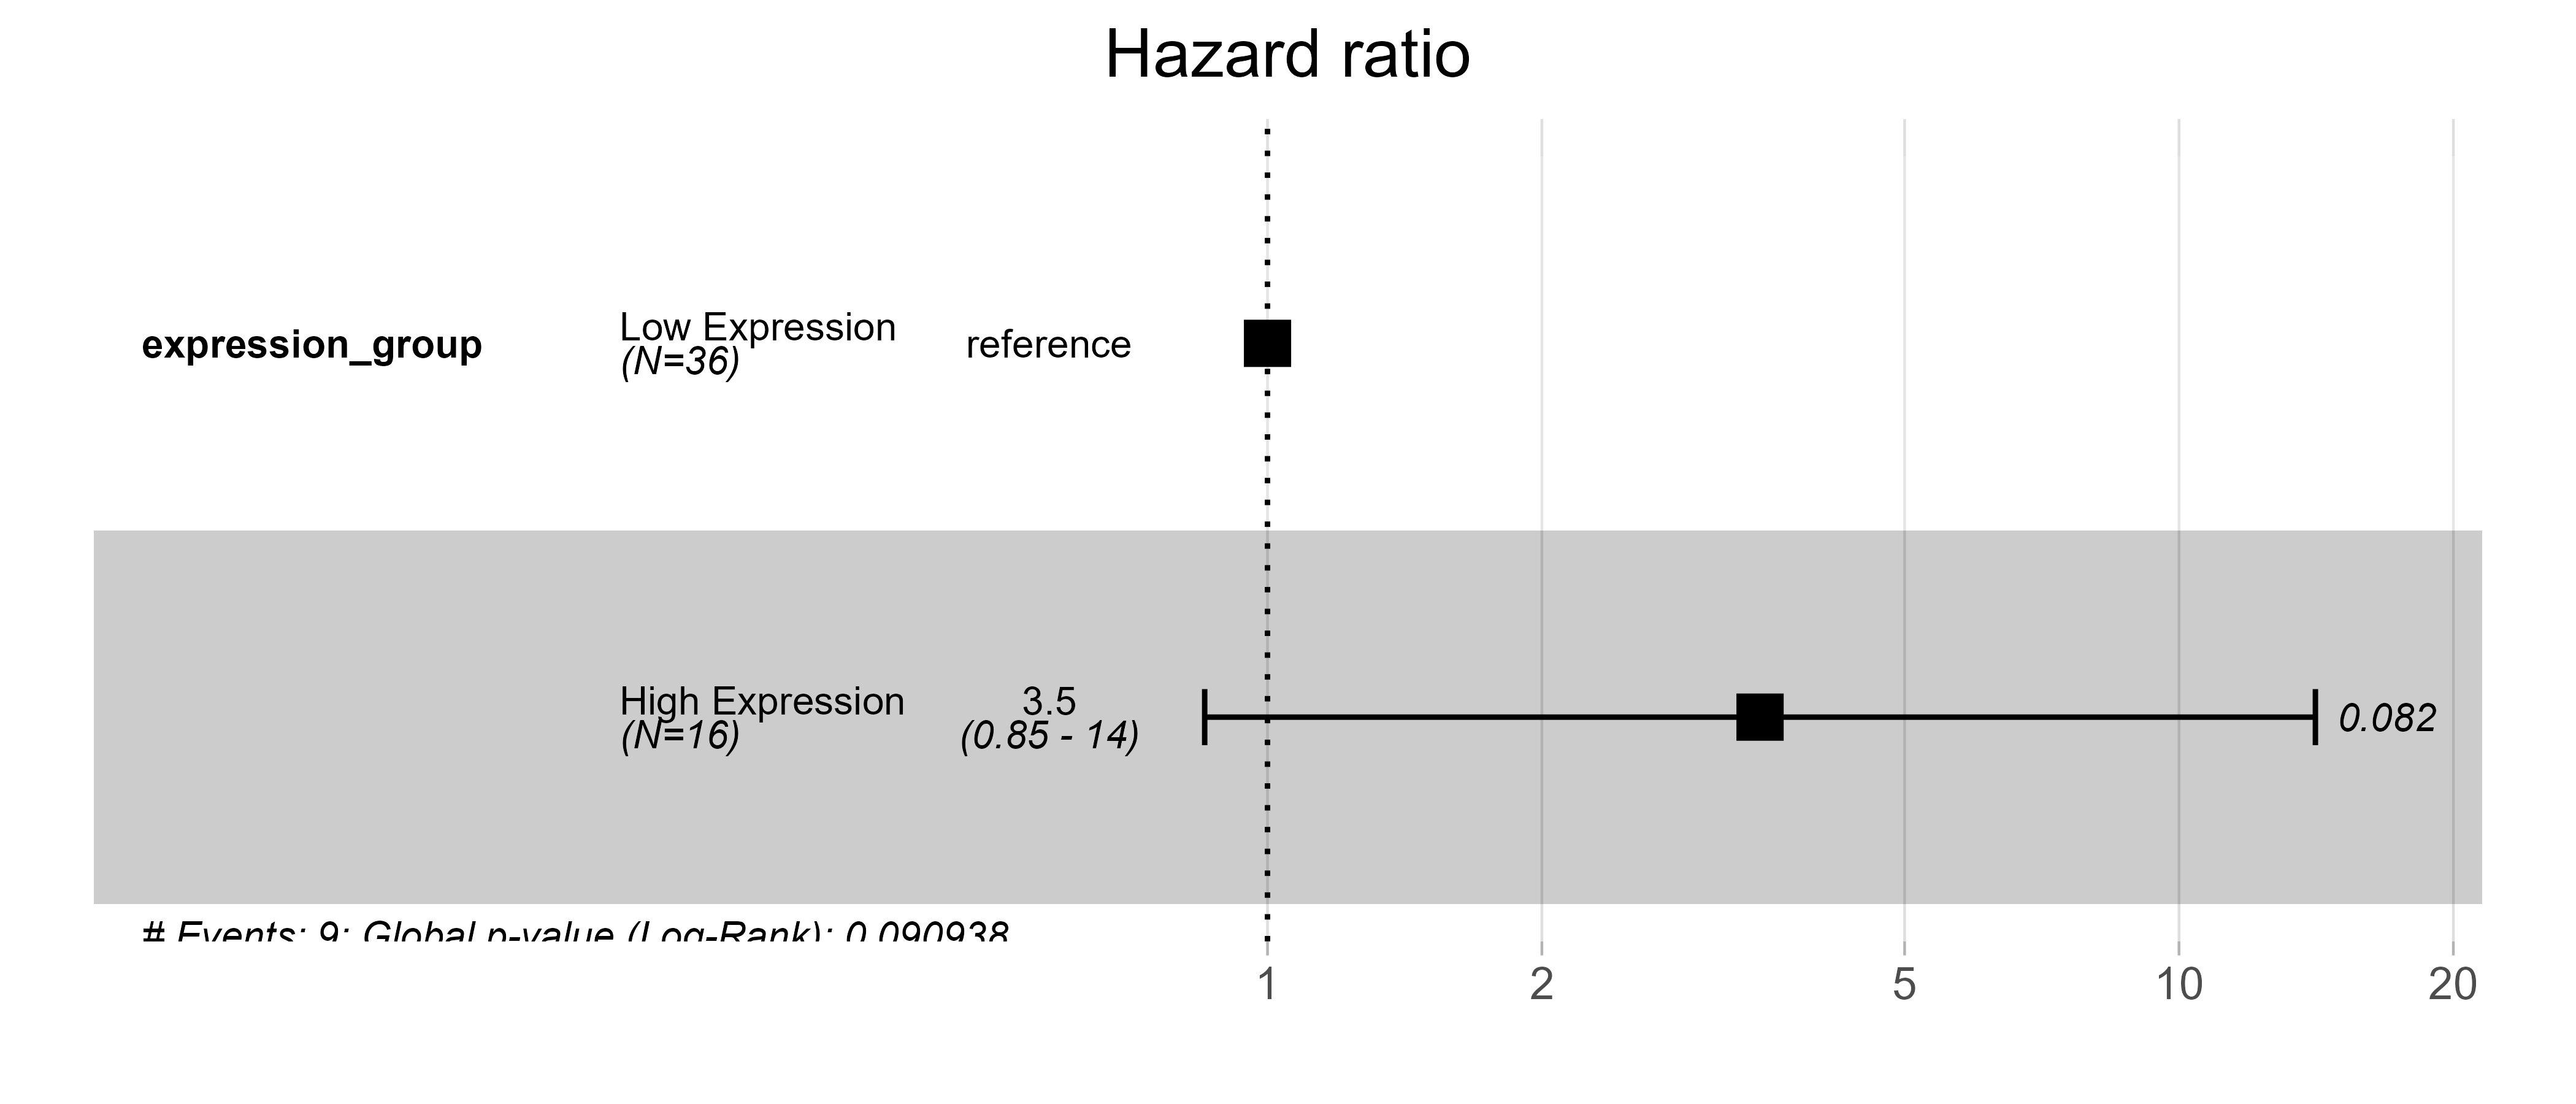
ANCHOR lines from the console output so I can self-check.运行成功后的锚点结果(52 例公开教学数据,9 个事件):截点 39.49,低组 36 人 / 高组 16 人,log-rank p = 0.069,Cox HR(High vs Low)= 3.47(95%CI 0.85–14.11,p = 0.082),marker 每单位 HR = 1.0422。对照自查:截点应在 marker 值域内、两组人数均 ≥30%。
示例效果(你的网站实跑结果会替换成自己的截图):
KM 曲线(蓝 = Low 组、红 = High 组)+ log-rank p + Number-at-risk 风险表:
单因素 Cox 森林图(分组 HR 与连续 marker 每单位 HR,附 95%CI 和 p 值):
Step 4|换成你自己的数据
准备一张随访表(xlsx 或 csv),至少 3 列:事件(0/1)、随访时间、连续 marker;其余列(如患者 ID)自动忽略;? 和空值自动转 NA。输入 prompt:
My own follow-up table is at: <paste the path to your xlsx or csv file here>.
1. First check my table: it must have at least 3 columns — event (0/1), follow-up time, and a
   continuous marker. Tell me which columns you identified as each, and warn me if the event
   count is <10 (Cox results will be unreliable; I should then do KM only or note it in the
   report).
2. This skill is a TEMPLATE script, not a CLI: copy scripts/survival_curve_template.R to a new
   file next to my data, then edit ONLY the CONFIG block at the top — set INPUT_FILE (and
   INPUT_SHEET if xlsx), COL_EVENT / COL_TIME / COL_MARKER to my column names. Do NOT change
   anything outside the CONFIG block, and do NOT write new analysis code from scratch.
3. Keep MIN_PROP at the default 0.30 unless I say otherwise; ask me about PALETTE and
   TIME_UNIT only if my time unit is not obvious.
4. Run the edited script, then read me the ANCHOR lines (the cutoff should be within the
   marker's value range; both groups should have ≥30% of samples) and show me the KM curve
   and the Cox forest plot.
5. Remind me of the methodological caveat: a data-driven cutoff systematically OVERESTIMATES
   group differences (optimism bias) — I must declare the cutoff method (maxstat via
   surv_cutpoint) in the manuscript and ideally validate it in an independent cohort.
等候 AI agent 运行结束:KM 曲线(600 dpi PNG + cairo PDF)+ Cox 森林图(600 dpi PNG + PDF)+ 三张统计 CSV(group_summary / risk_table / stats_summary)。
Step 5|读懂结果与 REPORT.md
输入 prompt:
Please explain the REPORT.md and all outputs in my survival-analysis results folder line
by line:
1. What each output file is and what it contains (the KM curve, the Cox forest plot, the
   three statistics CSVs);
2. Walk me through MY results: the optimal cutoff, the group sizes, the log-rank p value,
   and the Cox HRs with their 95% CIs — is my marker's effect significant?
3. Explain in plain language what the hazard ratio means here, and what optimism bias means
   for how strongly I can word my conclusions;
4. Any warnings or things I should pay attention to.
After explaining, tell me exactly what to write in the Methods section about the cutoff
determination (maxstat via surv_cutpoint, minprop = 0.30), and which files can be used
directly in a paper or presentation (PDF is vector with embedded fonts, best for journals;
600 dpi PNG for slides).
阅读完 AI 的解释,如果有不懂的直接问它。
更多分析
下面两个技能与本技能相关,安装方式完全相同(一键 prompt 或网站下载 zip 包):
临床统计表 —— clinical-table
一句话:患者级 CSV 进,论文 Table 1 基线特征表出。 KM 曲线的标准搭档——先出基线表证明两组可比,再上生存曲线。
详细介绍与下载:/zh/skills/clinical-table
分组柱状图 —— barplot
一句话:任何 2–6 组的实验数据一键出带统计标注的柱状图。 生存分析之外的组间比较数据用它。
详细介绍与下载:/zh/skills/barplot