
Zero-Basics — Survival Analysis Curves with an AI Agent (survival-curve) | Copy & Paste All the Way
This tutorial uses workbuddy as the AI agent and Hy3 as the AI API. For installing and configuring the AI agent itself, see the AI Agent setup tutorial.
Before you start (must read):
- If this is your first time doing data analysis with an AI agent, we strongly recommend following the bulk-RNA-seq differential analysis tutorial first, to learn the full "install skill → set up environment → run example → switch to your own data" workflow, then come back to this skill.
- This skill is standalone — it does not depend on the output of any other skill. Give it a follow-up table and it runs.
- In one sentence: a follow-up table in, Kaplan-Meier survival curves + risk table + univariate Cox forest plot out — automatic maxstat optimal cutoff, 600 dpi publication-grade PNG + PDF.
- ⚠️ Methodological warning (must read): a data-driven cutoff systematically overestimates group differences (optimism bias). You must declare the cutoff-determination method in your manuscript, and ideally validate it in an independent cohort; with too few events (<10), Cox results are unreliable — do KM only or note this in the report.
- This skill is a template script (not a CLI): switching to your own data only means editing the CONFIG block at the top of the script — the Step 4 prompt makes the AI do it for you. Runs directly on Windows, no WSL needed.
Tutorial structure:
- Step 1 | Install the survival-curve skill (one time only)
- Step 2 | Set up the runtime environment (one time only)
- Step 3 | Run the bundled example data
- Step 4 | Switch to your own data
- Step 5 | Read the results and REPORT.md
- More analysis | Related skills (clinical table / grouped barplot)
Step 1 | Install the survival-curve skill
Paste this prompt:
Please install the "survival-curve" skill for me, into the D:\claw2bio folder:
1. Create a folder named claw2bio in the root of the D: drive (if it doesn't exist yet).
2. From the GitHub repository https://github.com/nihuanhe/claw2bio, fetch ONLY the folder
   figure-generation/survival-curve (use sparse checkout — do NOT clone the whole repository),
   and place it at D:\claw2bio\survival-curve.
3. If downloading from GitHub fails or is too slow, download the zip from this mirror link instead:
   https://claw2bio.site/downloads/survival-curve.zip
   and extract it to D:\claw2bio\survival-curve.
4. Read the SKILL.md inside, then confirm to me that the skill is ready and list the contents
   of the folder.
(If my PC has no D: drive, install to C:\claw2bio instead and tell me the actual path.)
When Step 1 finishes, open the file manager and confirm that D:\claw2bio\survival-curve exists, with scripts/, examples/, SKILL.md, etc. inside.
Step 2 | Set up the runtime environment
If you already installed R (4.5 or above) while following the bulk-RNA-seq tutorial, this step only adds 4 packages. Paste this prompt:
Please set up the runtime environment for the "survival-curve" skill at
D:\claw2bio\survival-curve:
1. R should already be installed from the bulk-RNA-seq tutorial — verify that R is installed
   and report its version to me (it must be 4.2 or above; 4.5+ recommended). If R is missing,
   stop and tell me.
2. Install all R packages this skill needs: survival, survminer (must be ≥0.5), readxl, dplyr —
   from CRAN. If any package fails or is too slow, stop and tell me about it.
3. IMPORTANT: do NOT downgrade survminer below 0.5 — older versions have a surv_categorize
   behavior that breaks the template (it returns a character column instead of a factor).
4. When everything is installed, confirm to me that the skill can run.
Step 3 | Run the bundled example data
Paste this prompt:
The skill is installed at D:\claw2bio\survival-curve. Please run the bundled example:
1. Run the template script as-is: Rscript scripts/survival_curve_template.R — it auto-locates
   the example input.
2. Prefer the skill's own scripts in scripts/ — do NOT write new analysis code from scratch.
3. When the run succeeds, show me the KM curve and the Cox forest plot, and read me the
   ANCHOR lines from the console output so I can self-check.
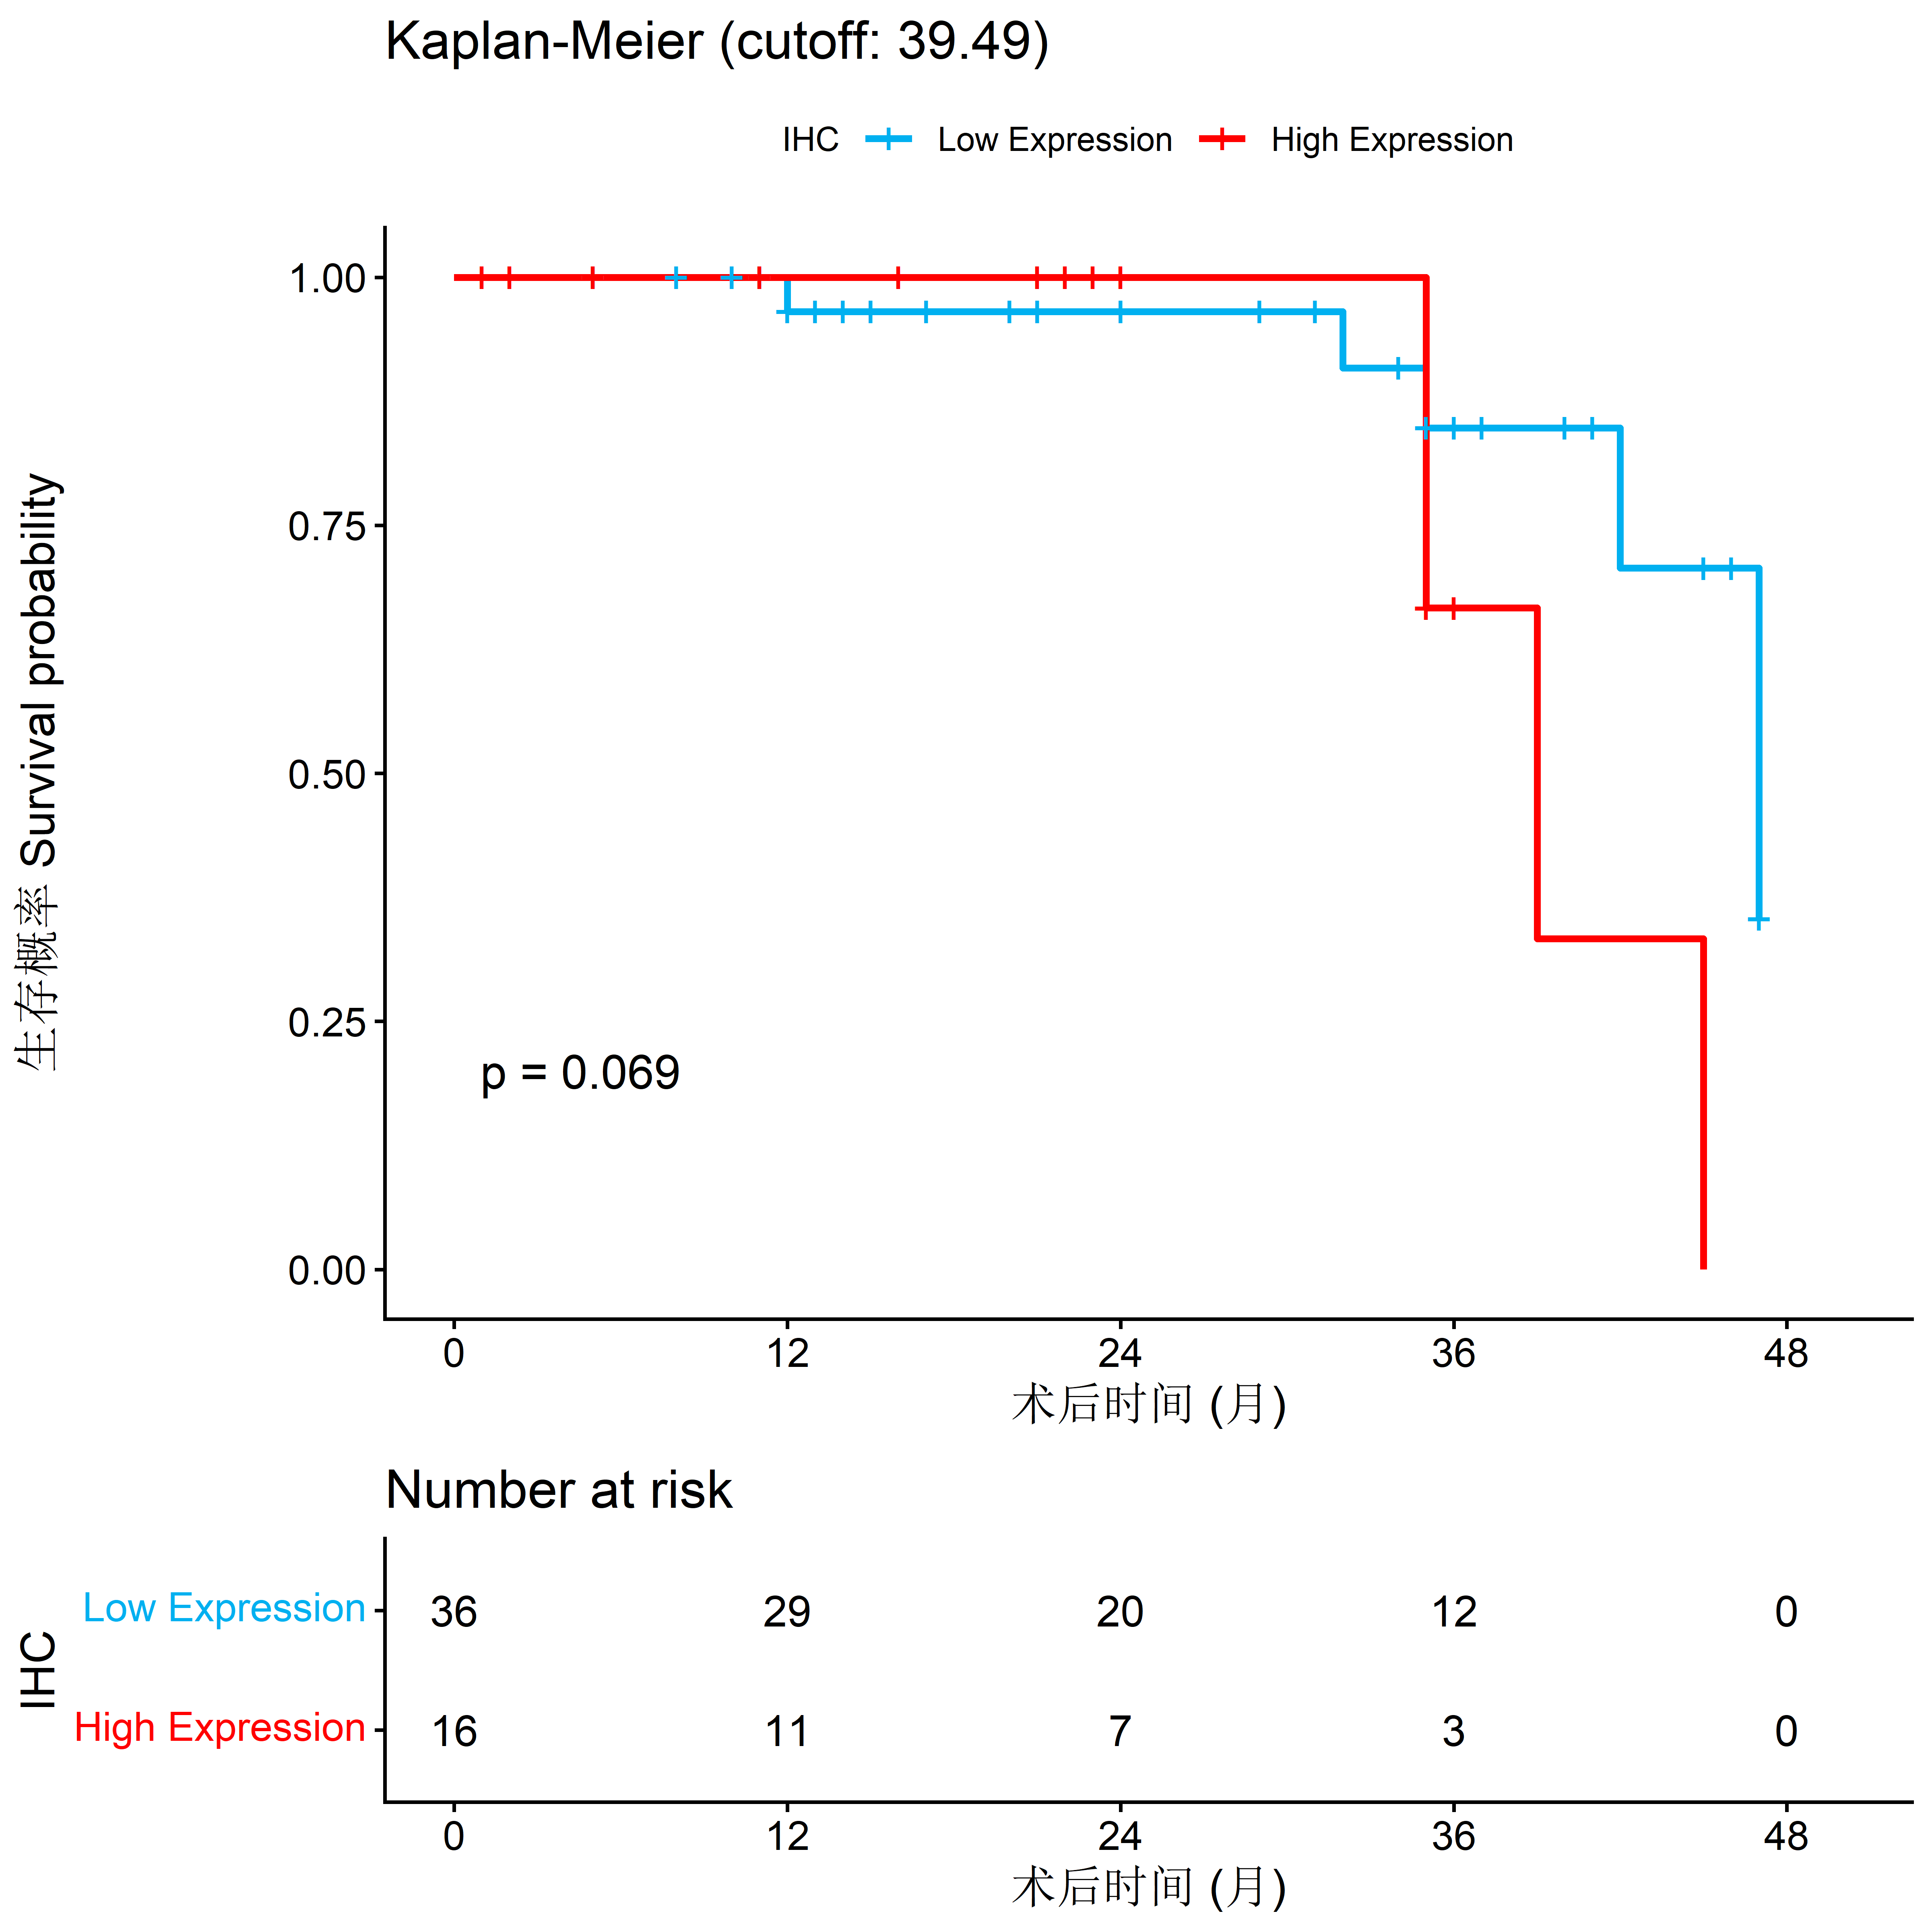
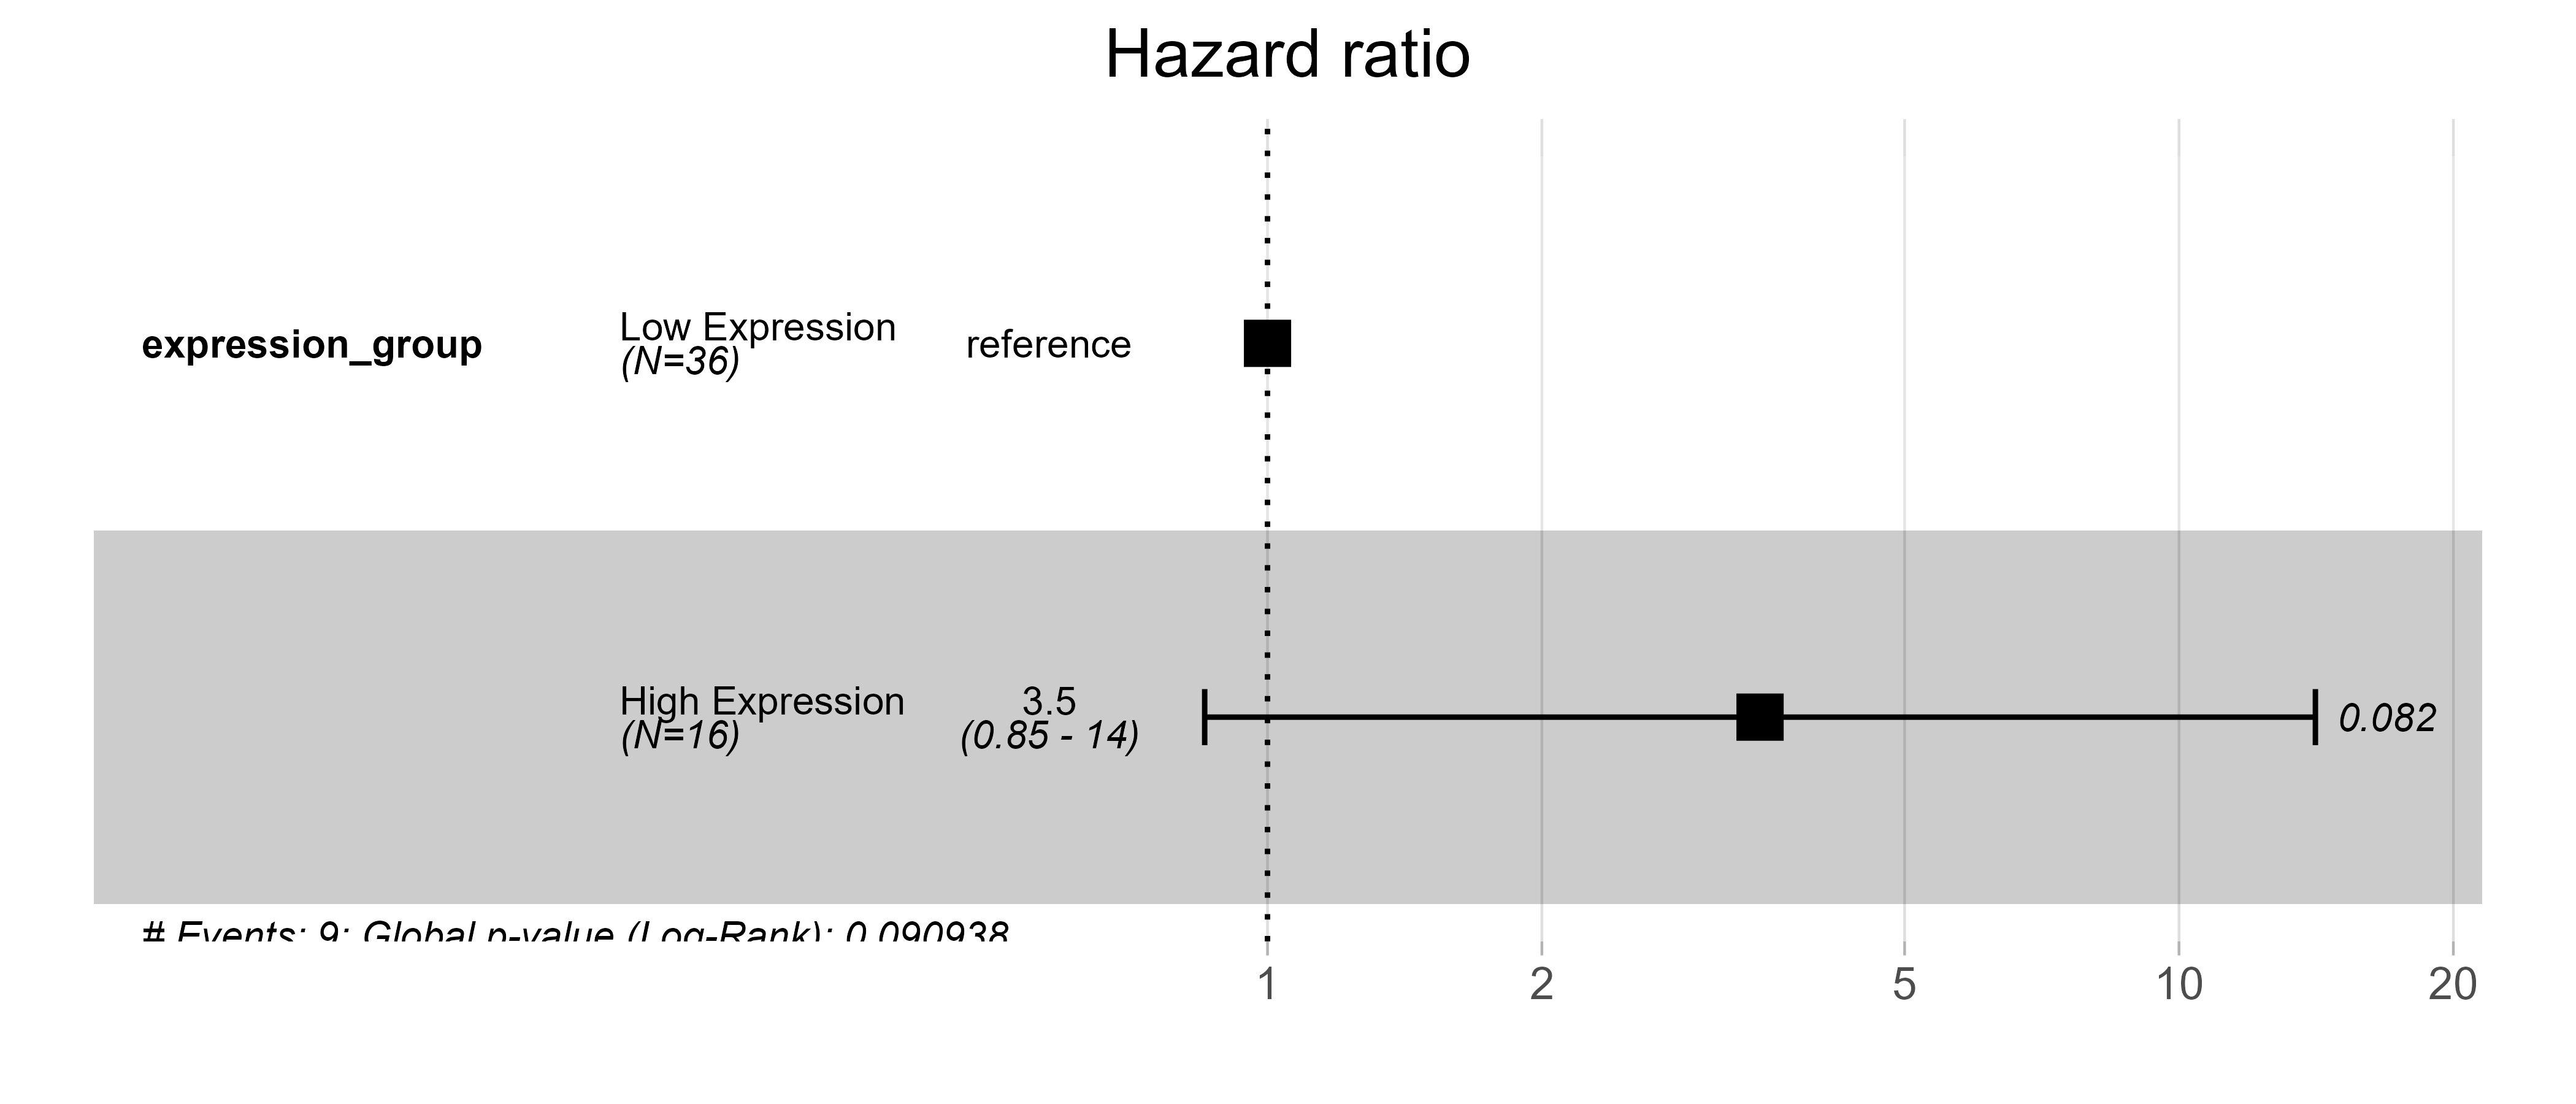
Anchor results for a successful run (52-case public teaching dataset, 9 events): cutoff 39.49, Low group 36 / High group 16, log-rank p = 0.069, Cox HR (High vs Low) = 3.47 (95%CI 0.85–14.11, p = 0.082), per-unit marker HR = 1.0422. Self-check: the cutoff should lie within the marker's value range, and both groups should hold ≥30% of samples.
Example figures (replace with your own screenshots later):
KM curve (blue = Low group, red = High group) + log-rank p + Number-at-risk table:
Univariate Cox forest plot (group HR and per-unit continuous-marker HR, with 95%CI and p values):
Step 4 | Switch to your own data
Prepare a follow-up table (xlsx or csv) with at least 3 columns: event (0/1), follow-up time, and a continuous marker; other columns (e.g., patient ID) are ignored automatically; ? and empty cells are converted to NA. Paste this prompt:
My own follow-up table is at: <paste the path to your xlsx or csv file here>.
1. First check my table: it must have at least 3 columns — event (0/1), follow-up time, and a
   continuous marker. Tell me which columns you identified as each, and warn me if the event
   count is <10 (Cox results will be unreliable; I should then do KM only or note it in the
   report).
2. This skill is a TEMPLATE script, not a CLI: copy scripts/survival_curve_template.R to a new
   file next to my data, then edit ONLY the CONFIG block at the top — set INPUT_FILE (and
   INPUT_SHEET if xlsx), COL_EVENT / COL_TIME / COL_MARKER to my column names. Do NOT change
   anything outside the CONFIG block, and do NOT write new analysis code from scratch.
3. Keep MIN_PROP at the default 0.30 unless I say otherwise; ask me about PALETTE and
   TIME_UNIT only if my time unit is not obvious.
4. Run the edited script, then read me the ANCHOR lines (the cutoff should be within the
   marker's value range; both groups should have ≥30% of samples) and show me the KM curve
   and the Cox forest plot.
5. Remind me of the methodological caveat: a data-driven cutoff systematically OVERESTIMATES
   group differences (optimism bias) — I must declare the cutoff method (maxstat via
   surv_cutpoint) in the manuscript and ideally validate it in an independent cohort.
Wait for the AI agent to finish: the KM curve (600 dpi PNG + cairo PDF) + the Cox forest plot (600 dpi PNG + PDF) + three statistics CSVs (group_summary / risk_table / stats_summary).
Step 5 | Read the results and REPORT.md
Paste this prompt:
Please explain the REPORT.md and all outputs in my survival-analysis results folder line
by line:
1. What each output file is and what it contains (the KM curve, the Cox forest plot, the
   three statistics CSVs);
2. Walk me through MY results: the optimal cutoff, the group sizes, the log-rank p value,
   and the Cox HRs with their 95% CIs — is my marker's effect significant?
3. Explain in plain language what the hazard ratio means here, and what optimism bias means
   for how strongly I can word my conclusions;
4. Any warnings or things I should pay attention to.
After explaining, tell me exactly what to write in the Methods section about the cutoff
determination (maxstat via surv_cutpoint, minprop = 0.30), and which files can be used
directly in a paper or presentation (PDF is vector with embedded fonts, best for journals;
600 dpi PNG for slides).
After reading the AI's explanation, if anything is unclear, just ask it directly.
More analysis
The two skills below are related and installed in exactly the same way (one-click prompt or zip download):
Clinical table — clinical-table
One sentence: patient-level CSV in, a paper-style Table 1 baseline-characteristics table out. The standard companion of a KM curve — first show the cohorts are comparable with a baseline table, then present the survival curves.
Details & download: /skills/clinical-table
Grouped barplot — barplot
One sentence: any 2–6 group experimental data → barplot with statistics in one shot. For group comparisons beyond survival analysis, use this one.
Details & download: /skills/barplot