
零基础——用 AI Agent 画指定基因表达对比图(RNA-seq-gene-plot) | 全程复制粘贴
本教程以 workbuddy 作为 AI agent、Hy3 作为 AI API 为例。AI agent 本身的安装与配置请看AI Agent 安装教程。
在开始之前(必读):
- 如果你是第一次用 AI agent 做生信分析,强烈建议先跟一遍 bulk-RNA-seq 差异分析教程,熟悉"装技能 → 配环境 → 跑示例 → 换自己数据"的完整流程,再回来做本技能。
- 本技能是 bulk-RNA-seq 的下游技能:它吃的是 bulk-RNA-seq 流程产出的归一化表达矩阵(
normalized_expression.csv)和分组表(sample_metadata.csv)。请先跑完 bulk-RNA-seq 教程并保留好它的 output 文件夹。 - 一句话:把某个基因从归一化矩阵里单独拎出来画图——某基因在各组表达多少,或同组内两个基因谁高谁低,带误差线、散点和统计标注。依赖只有 ggplot2,是全库最轻量的技能之一。
教程结构:
- Step 1|安装 RNA-seq-gene-plot 技能(只需一次)
- Step 2|配置运行环境(只需一次)
- Step 3|跑通示例数据
- Step 4|换成你自己的数据
- Step 5|读懂 REPORT.md
- 更多分析|下游技能简介(富集分析 / GSEA)
Step 1|Install the RNA-seq-gene-plot skill
输入以下 prompt:
Please install the "RNA-seq-gene-plot" skill for me, into the D:\claw2bio folder:
1. Create a folder named claw2bio in the root of the D: drive (if it doesn't exist yet).
2. From the GitHub repository https://github.com/nihuanhe/claw2bio, fetch ONLY the folder
   bioinformatics/bulk_RNA_seq/RNA-seq-gene-plot (use sparse checkout — do NOT clone the whole
   repository), and place it at D:\claw2bio\RNA-seq-gene-plot.
3. If downloading from GitHub fails or is too slow, download the zip from this mirror link instead:
   https://claw2bio.site/downloads/RNA-seq-gene-plot.zip
   and extract it to D:\claw2bio\RNA-seq-gene-plot.
4. Read the SKILL.md inside, then confirm to me that the skill is ready and list the contents
   of the folder.
(If my PC has no D: drive, install to C:\claw2bio instead and tell me the actual path.)
Step 1 完成后,打开文件管理器确认 D:\claw2bio\RNA-seq-gene-plot 文件夹存在,里面有 scripts/、examples/、SKILL.md 等内容。
Step 2|Set up the runtime environment
本技能只需要 R + ggplot2,如果你已经按 bulk-RNA-seq 教程装好了 R,这一步非常快。输入 prompt:
Please set up the runtime environment for the "RNA-seq-gene-plot" skill at
D:\claw2bio\RNA-seq-gene-plot:
1. R should already be installed from the bulk-RNA-seq tutorial — verify that R is installed
   and report its version to me (it must be 4.5 or above). If R is missing, stop and tell me.
2. This skill only needs ggplot2 (statistics use base R). Check whether ggplot2 is installed;
   if not, install it from CRAN.
3. When everything is ready, confirm to me that the skill can run.
Step 3|跑通示例数据
输入 prompt:
The skill is installed at D:\claw2bio\RNA-seq-gene-plot. Please run the bundled example:
1. Example input is at D:\claw2bio\RNA-seq-gene-plot\examples\input\ (normalized_expression.csv
   and sample_metadata.csv).
2. Write results to D:\claw2bio\RNA-seq-gene-plot\examples\output\
3. Plot the genes Trp53 and Gapdh, with Control as the control group.
4. Prefer the skill's own scripts in scripts/ — do NOT write new analysis code from scratch.
5. When the run succeeds, show me both result figures: the per-gene across-group barplot and
   the within-group two-gene comparison plot; then explain the generated REPORT.md line by line.
运行成功后,你应该看到两类图(示例效果如下,你的网站实跑结果会替换成自己的截图):
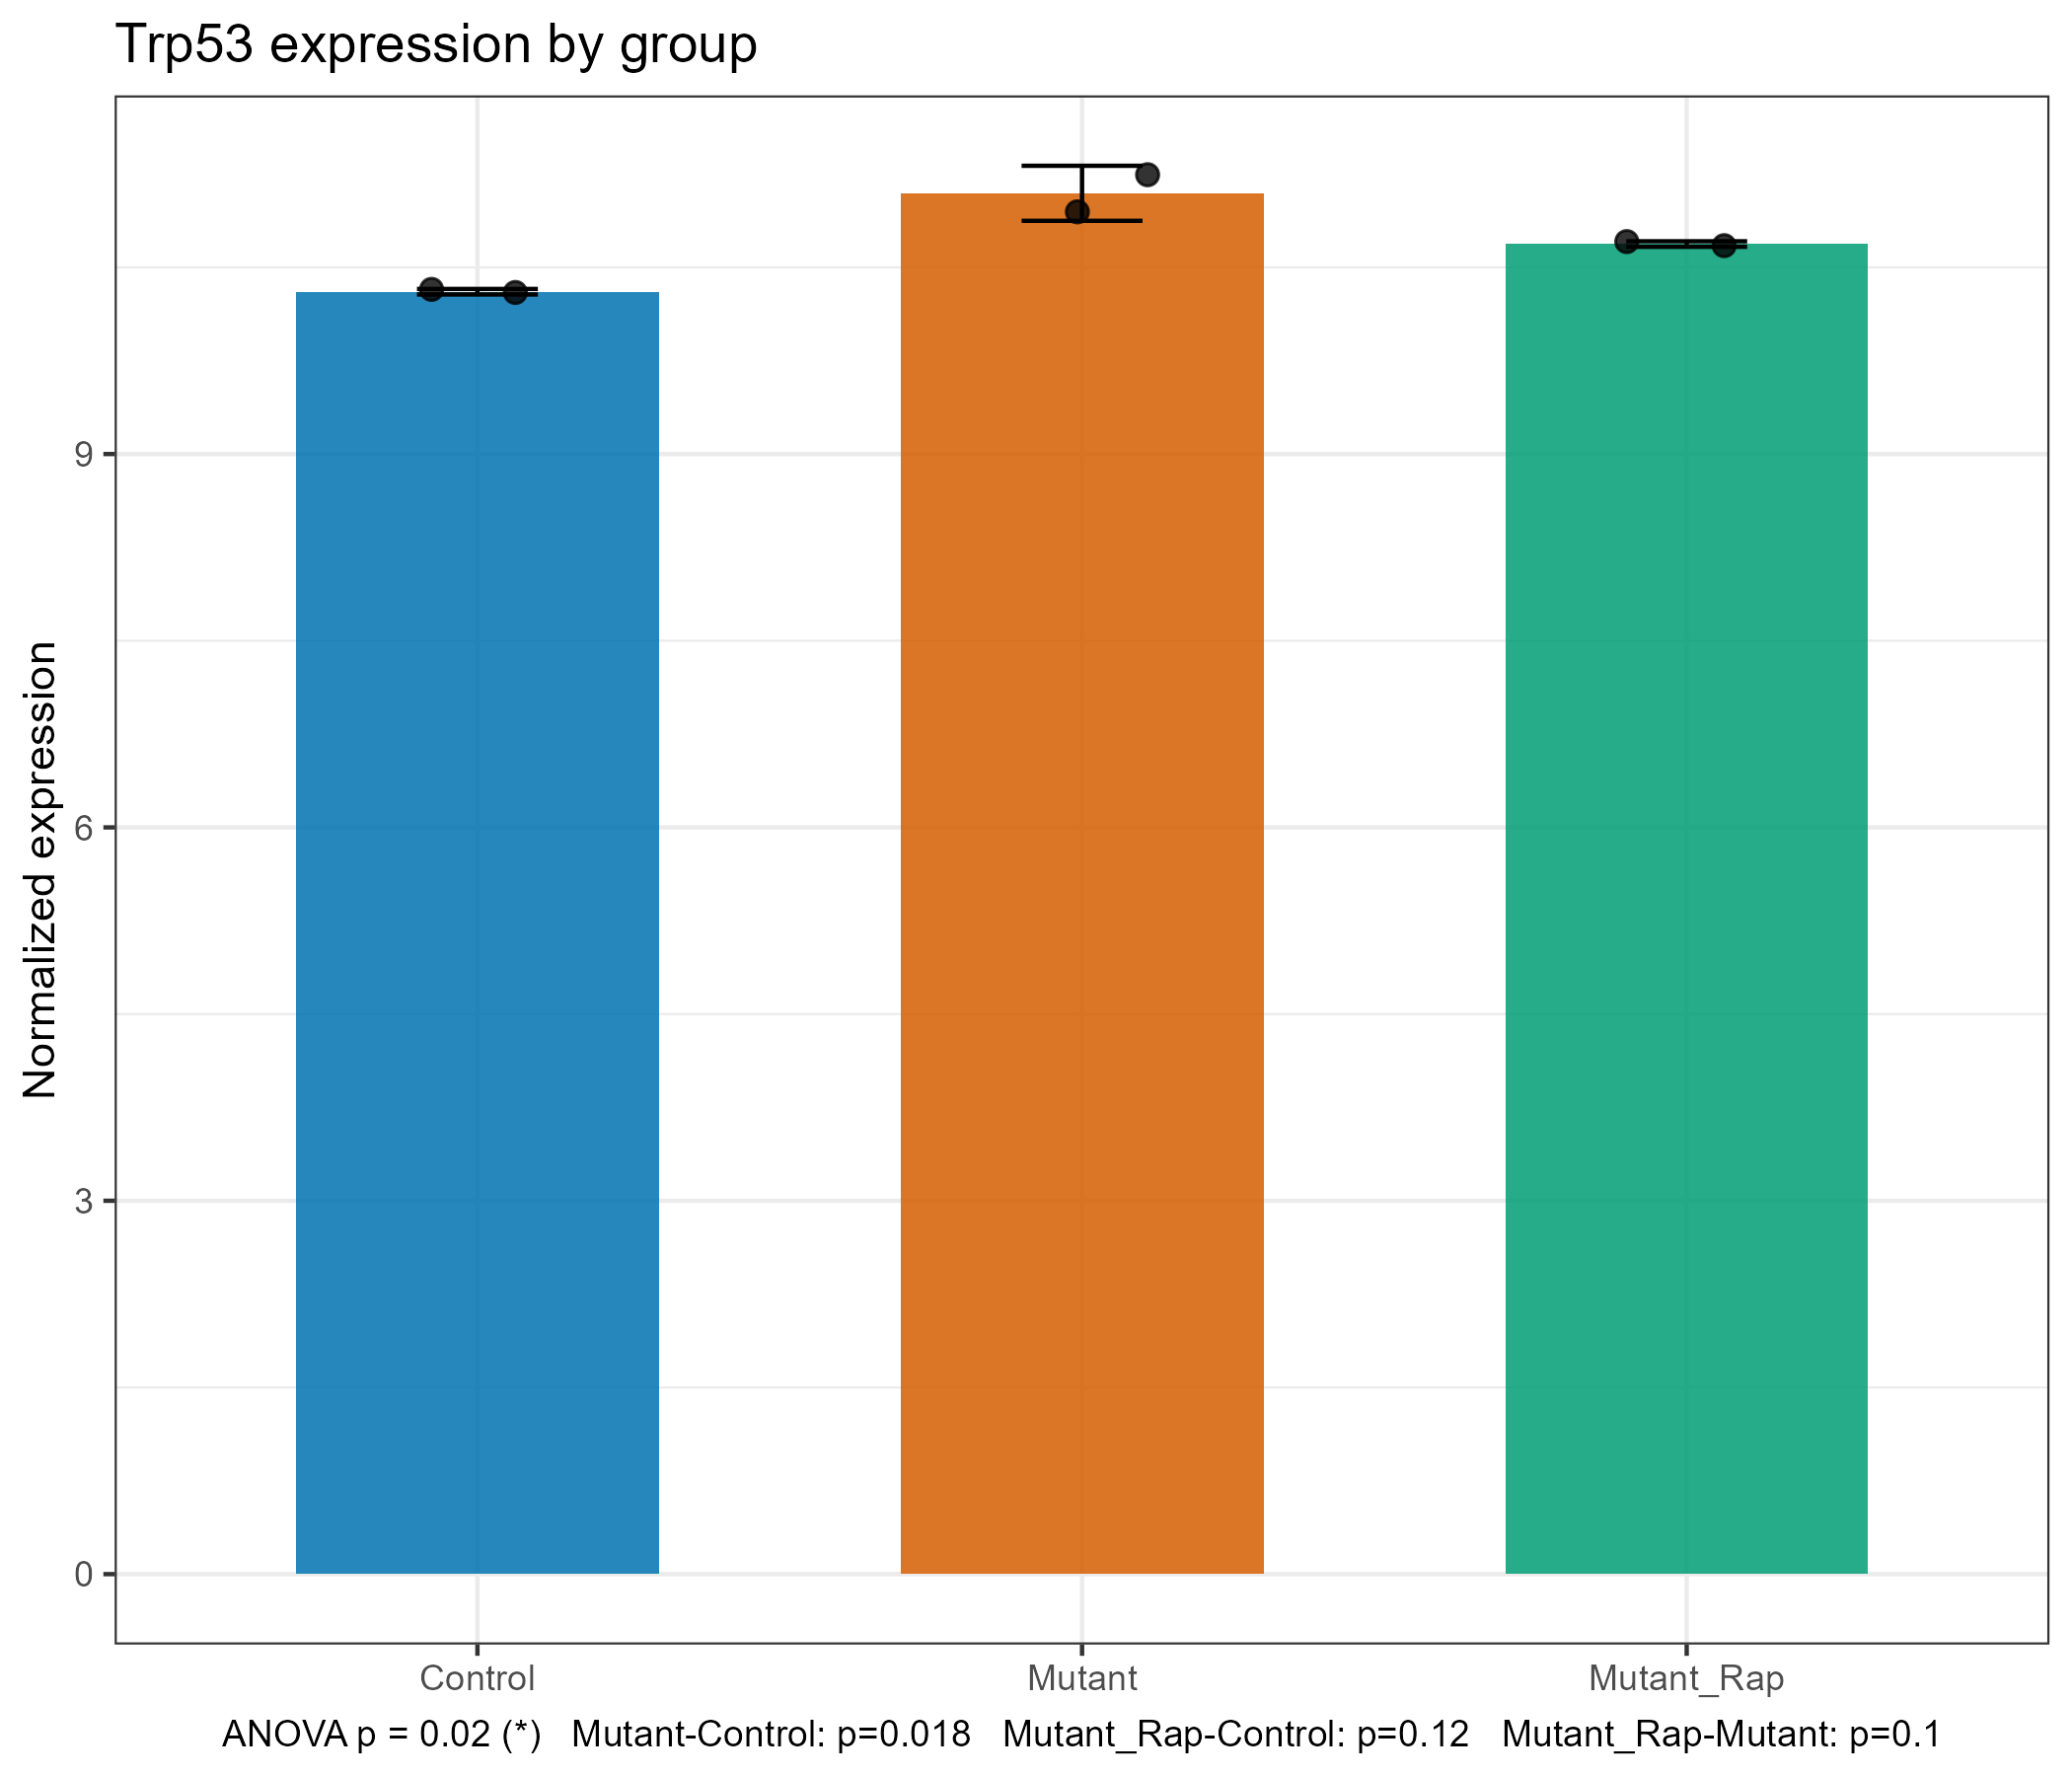
某基因在各组的表达丰度(均值 ± SD + 抖动散点 + 显著性标注):
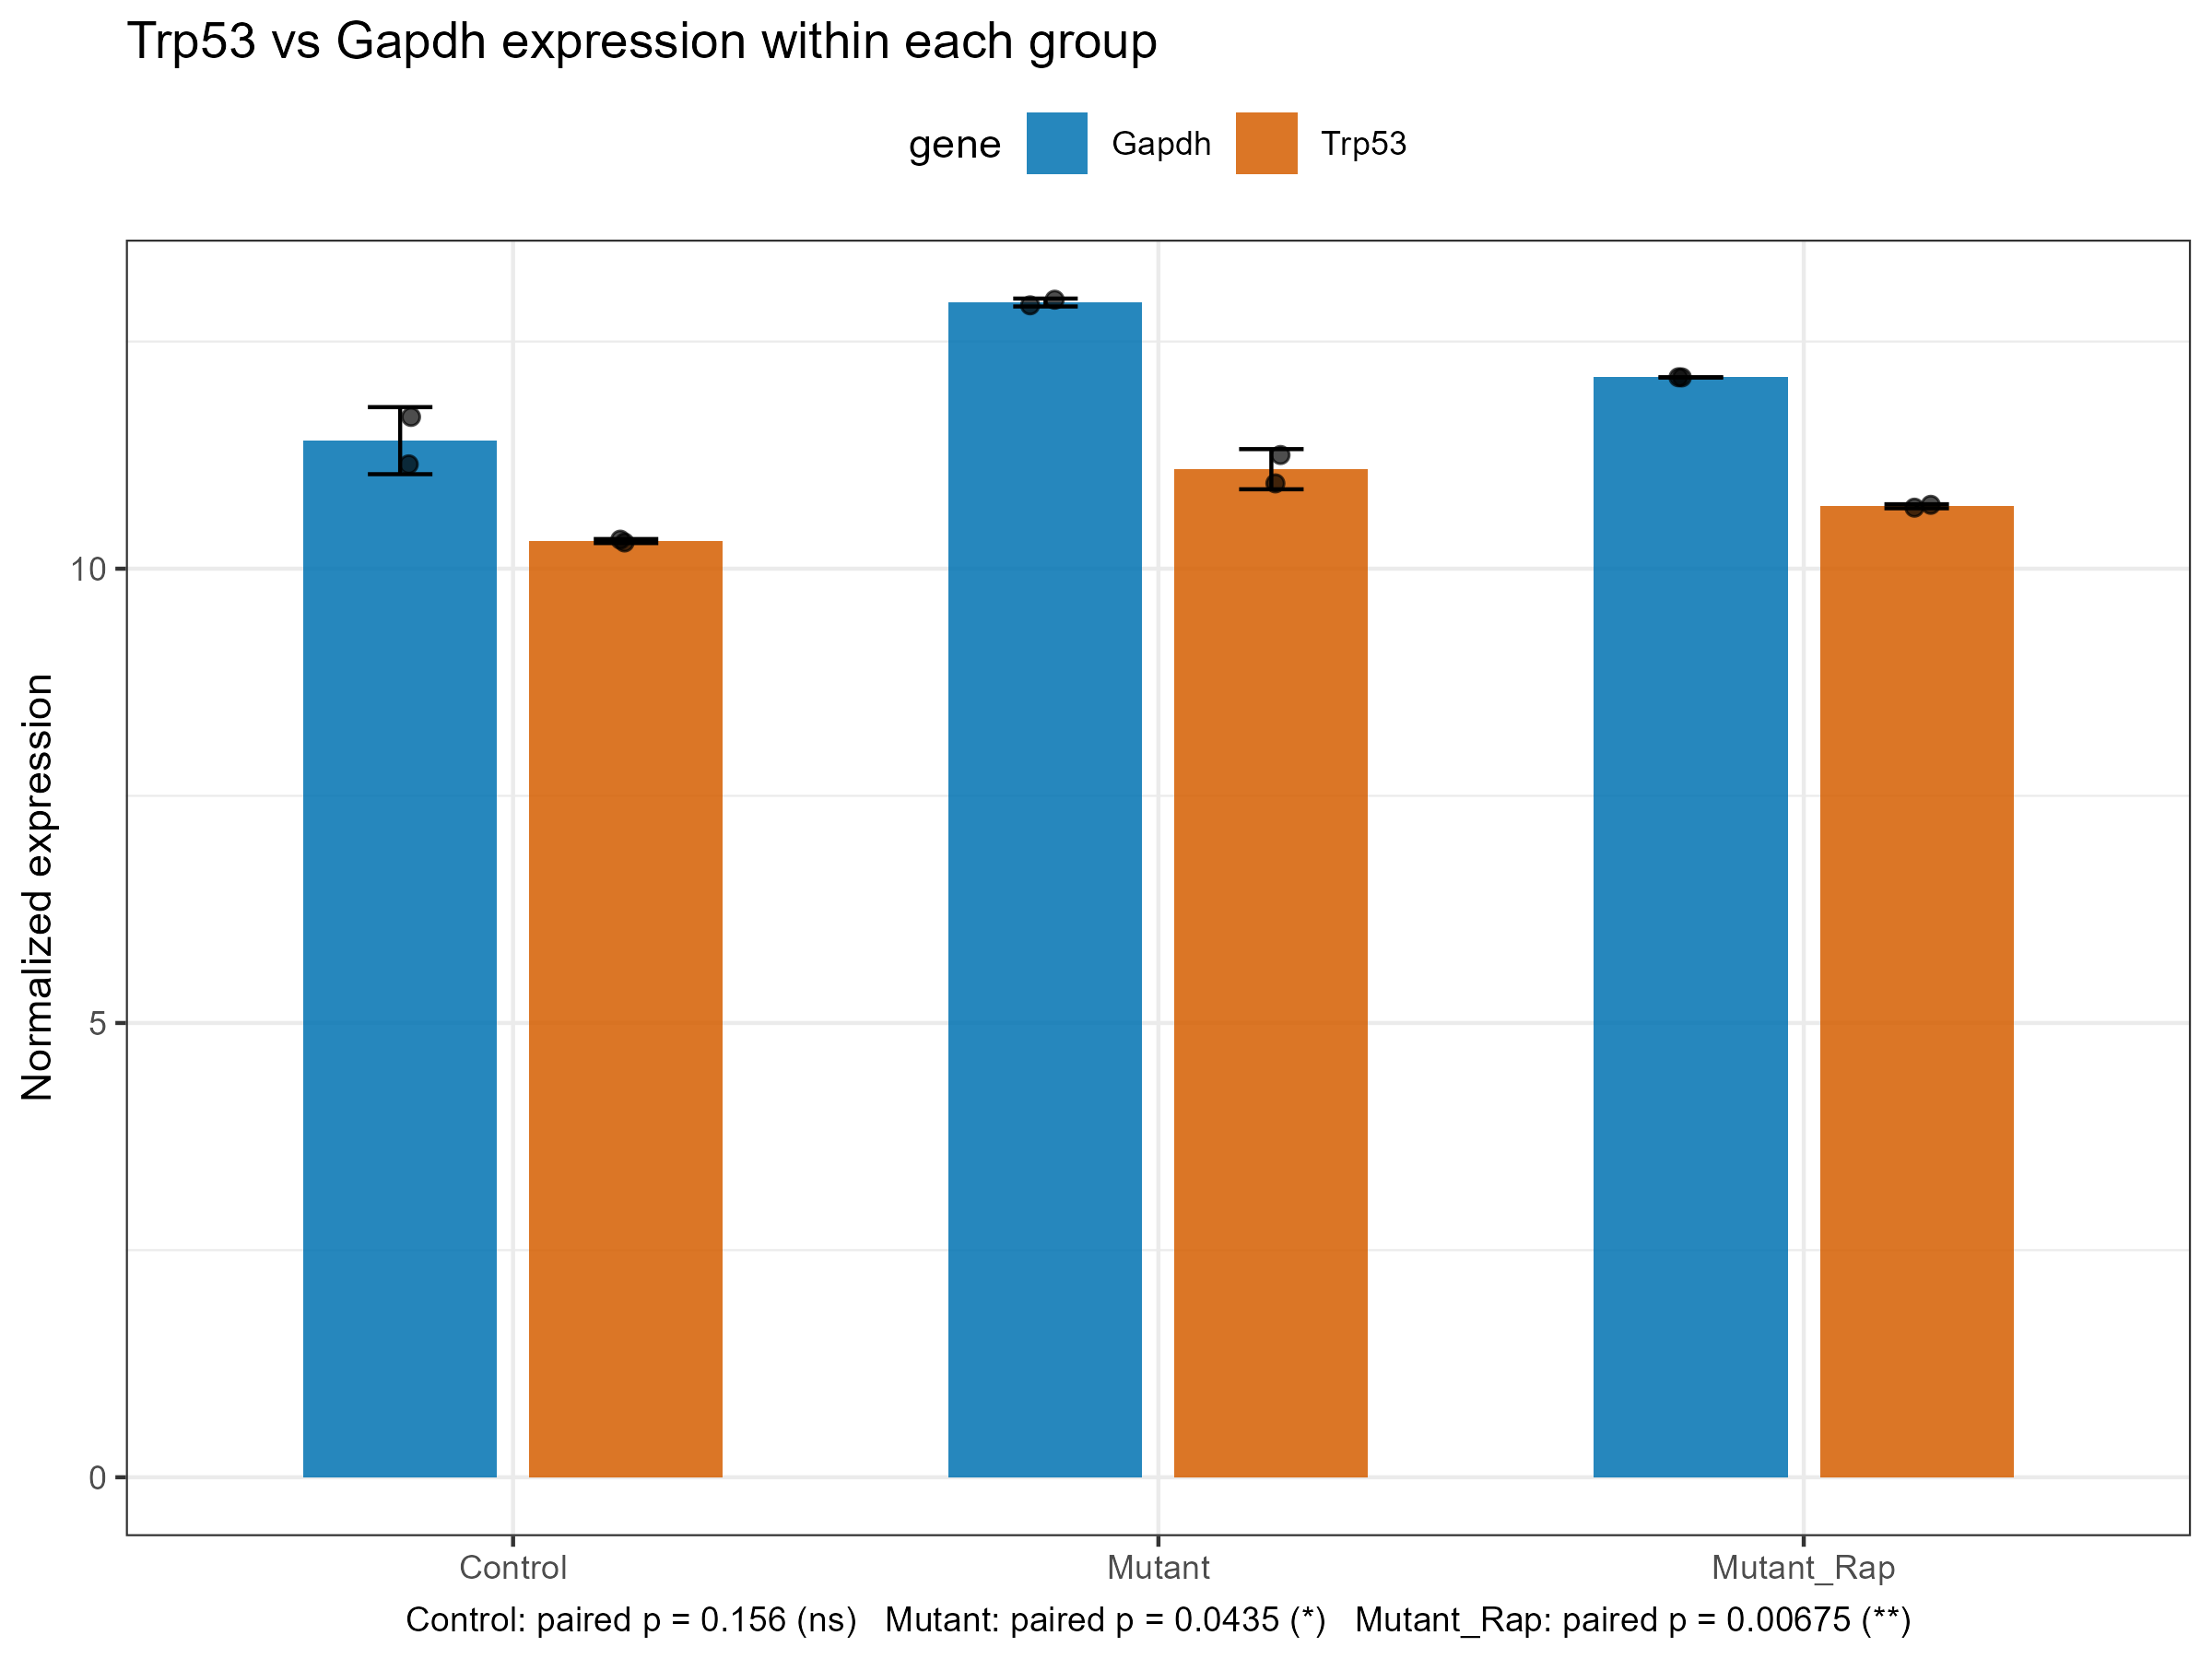
同组内两个基因的配对比较柱状图(配对 t 检验):
Step 4|换成你自己的数据
把 bulk-RNA-seq 流程跑出来的你自己的 output 文件夹交给它(里面应有归一化矩阵和分组表)。输入 prompt:
My own bulk-RNA-seq results are at: <paste the path to your bulk-RNA-seq output folder here —
it should contain normalized_expression.csv and sample_metadata.csv>.
Please plot the expression of these genes: <write your genes here, e.g., Trp53,Myc,Gapdh —
use the species-correct spelling: all-caps for human like TP53, first-letter-capitalized for
mouse like Trp53>.
1. First check whether my matrix and metadata have any format problems (e.g., sample names not
   matching between the two files); if so, fix them and tell me what you did.
2. Use Control as the control group for group ordering; if my control group has a different
   name, ask me first.
3. Prefer the skill's own scripts in scripts/; if anything needs adapting, make the smallest
   possible change — do NOT write large amounts of new code.
4. Show me the across-group barplot for each gene and, if I gave you 2 or more genes, the
   within-group comparison plot as well.
等候 AI agent 运行结束:每个基因出一张跨组柱状图(2 组 t 检验、≥3 组 ANOVA + Tukey,统计方法标在图注里),给 2 个以上基因时还会出同组内配对对比图。
Step 5|读懂 REPORT.md
让 AI 给你解析结果:
Please explain the REPORT.md in my gene-plot results folder line by line:
1. What each output file is and what it contains (the PNG/PDF figures and the numeric CSVs);
2. For each gene I plotted: which groups differ significantly, and which statistical test was
   used and why;
3. Any warnings or things I should pay attention to (e.g., a gene not found, or filtered out
   by low-expression filtering upstream).
After explaining, tell me which figures can be used directly in a paper or presentation.
阅读完 AI 的解释,如果有不懂的直接问它。
更多分析
本技能只画指定基因的表达对比图。下面两个技能与它是同一批下游,安装方式完全相同(一键 prompt 或网站下载 zip 包),都吃 bulk-RNA-seq 的 output:
富集分析(GO / KEGG / Reactome)—— RNA-seq-enrichment
一句话:DEG 表进,GO / KEGG / Reactome 富集表和点图出。 每个对比自动拆上调/下调两个基因集,每个方向 × 每个通路库各出一张表和一张点图,断网也能出图。
详细介绍与下载:/zh/skills/RNA-seq-enrichment
GSEA —— RNA-seq-GSEA
一句话:不设阈值,用全基因排序列表做富集。 对 MSigDB 格式的 GMT 基因集做 fgsea 富集,内置 Reactome 演示基因集开箱即用。
详细介绍与下载:/zh/skills/RNA-seq-GSEA