
零基础——用 AI Agent 画分组柱状图(barplot) | 全程复制粘贴
本教程以 workbuddy 作为 AI agent、Hy3 作为 AI API 为例。AI agent 本身的安装与配置请看AI Agent 安装教程。
在开始之前(必读):
- 如果你是第一次用 AI agent 做数据分析,强烈建议先跟一遍 bulk-RNA-seq 差异分析教程,熟悉"装技能 → 配环境 → 跑示例 → 换自己数据"的完整流程,再回来做本技能。
- 本技能是独立技能,不依赖任何其他技能的输出——给一张宽表 CSV 就能跑。
- 一句话:宽表 CSV 进,发表级分组柱状图出——自动识别 2–6 组,带均值、SD 误差线、抖动散点和统计标注(2 组 t 检验;≥3 组 ANOVA + Tukey HSD),300 dpi。ELISA、WB 灰度、细胞计数……任何分组实验数据都能用。
- 本技能用的是 Python,环境配置很轻。
教程结构:
- Step 1|安装 barplot 技能(只需一次)
- Step 2|配置运行环境(只需一次)
- Step 3|跑通示例数据
- Step 4|换成你自己的数据
- Step 5|让 AI 解读结果与自定义样式
- 更多分析|相关技能简介(qPCR / 临床统计表 / 生存曲线)
Step 1|Install the barplot skill
输入以下 prompt:
Please install the "barplot" skill for me, into the D:\claw2bio folder:
1. Create a folder named claw2bio in the root of the D: drive (if it doesn't exist yet).
2. From the GitHub repository https://github.com/nihuanhe/claw2bio, fetch ONLY the folder
   figure-generation/barplot (use sparse checkout — do NOT clone the whole repository),
   and place it at D:\claw2bio\barplot.
3. If downloading from GitHub fails or is too slow, download the zip from this mirror link instead:
   https://claw2bio.site/downloads/barplot.zip
   and extract it to D:\claw2bio\barplot.
4. Read the SKILL.md inside, then confirm to me that the skill is ready and list the contents
   of the folder.
(If my PC has no D: drive, install to C:\claw2bio instead and tell me the actual path.)
Step 1 完成后,打开文件管理器确认 D:\claw2bio\barplot 文件夹存在,里面有 scripts/、examples/、SKILL.md 等内容。
Step 2|Set up the runtime environment
输入 prompt:
Please set up the runtime environment for the "barplot" skill at D:\claw2bio\barplot:
1. First, SEARCH THIS PC for an existing Python installation. If Python is already installed,
   report its version to me. Only if Python is NOT installed at all, install a recent Python 3
   (Windows), downloaded from the official python.org website, accepting all default options —
   and make sure to check "Add python.exe to PATH" during installation.
2. Install all Python packages this skill needs: pandas, numpy, scipy, matplotlib, statsmodels
   (use pip; if a package fails or is too slow, stop and tell me about it).
3. When everything is installed, confirm to me that the skill can run.
Step 3|跑通示例数据
输入 prompt:
The skill is installed at D:\claw2bio\barplot. Please run the bundled example:
1. Example input is at D:\claw2bio\barplot\examples\input\data.csv
2. Run the skill's own script: python scripts/run_barplot.py examples/input/data.csv
   (the figure is saved NEXT TO the input CSV as data_barplot.png).
3. Prefer the skill's own scripts in scripts/ — do NOT write new analysis code from scratch.
4. When the run succeeds, show me the output figure and explain it: how many groups were
   detected, which statistical test was used, and what the significance labels mean.
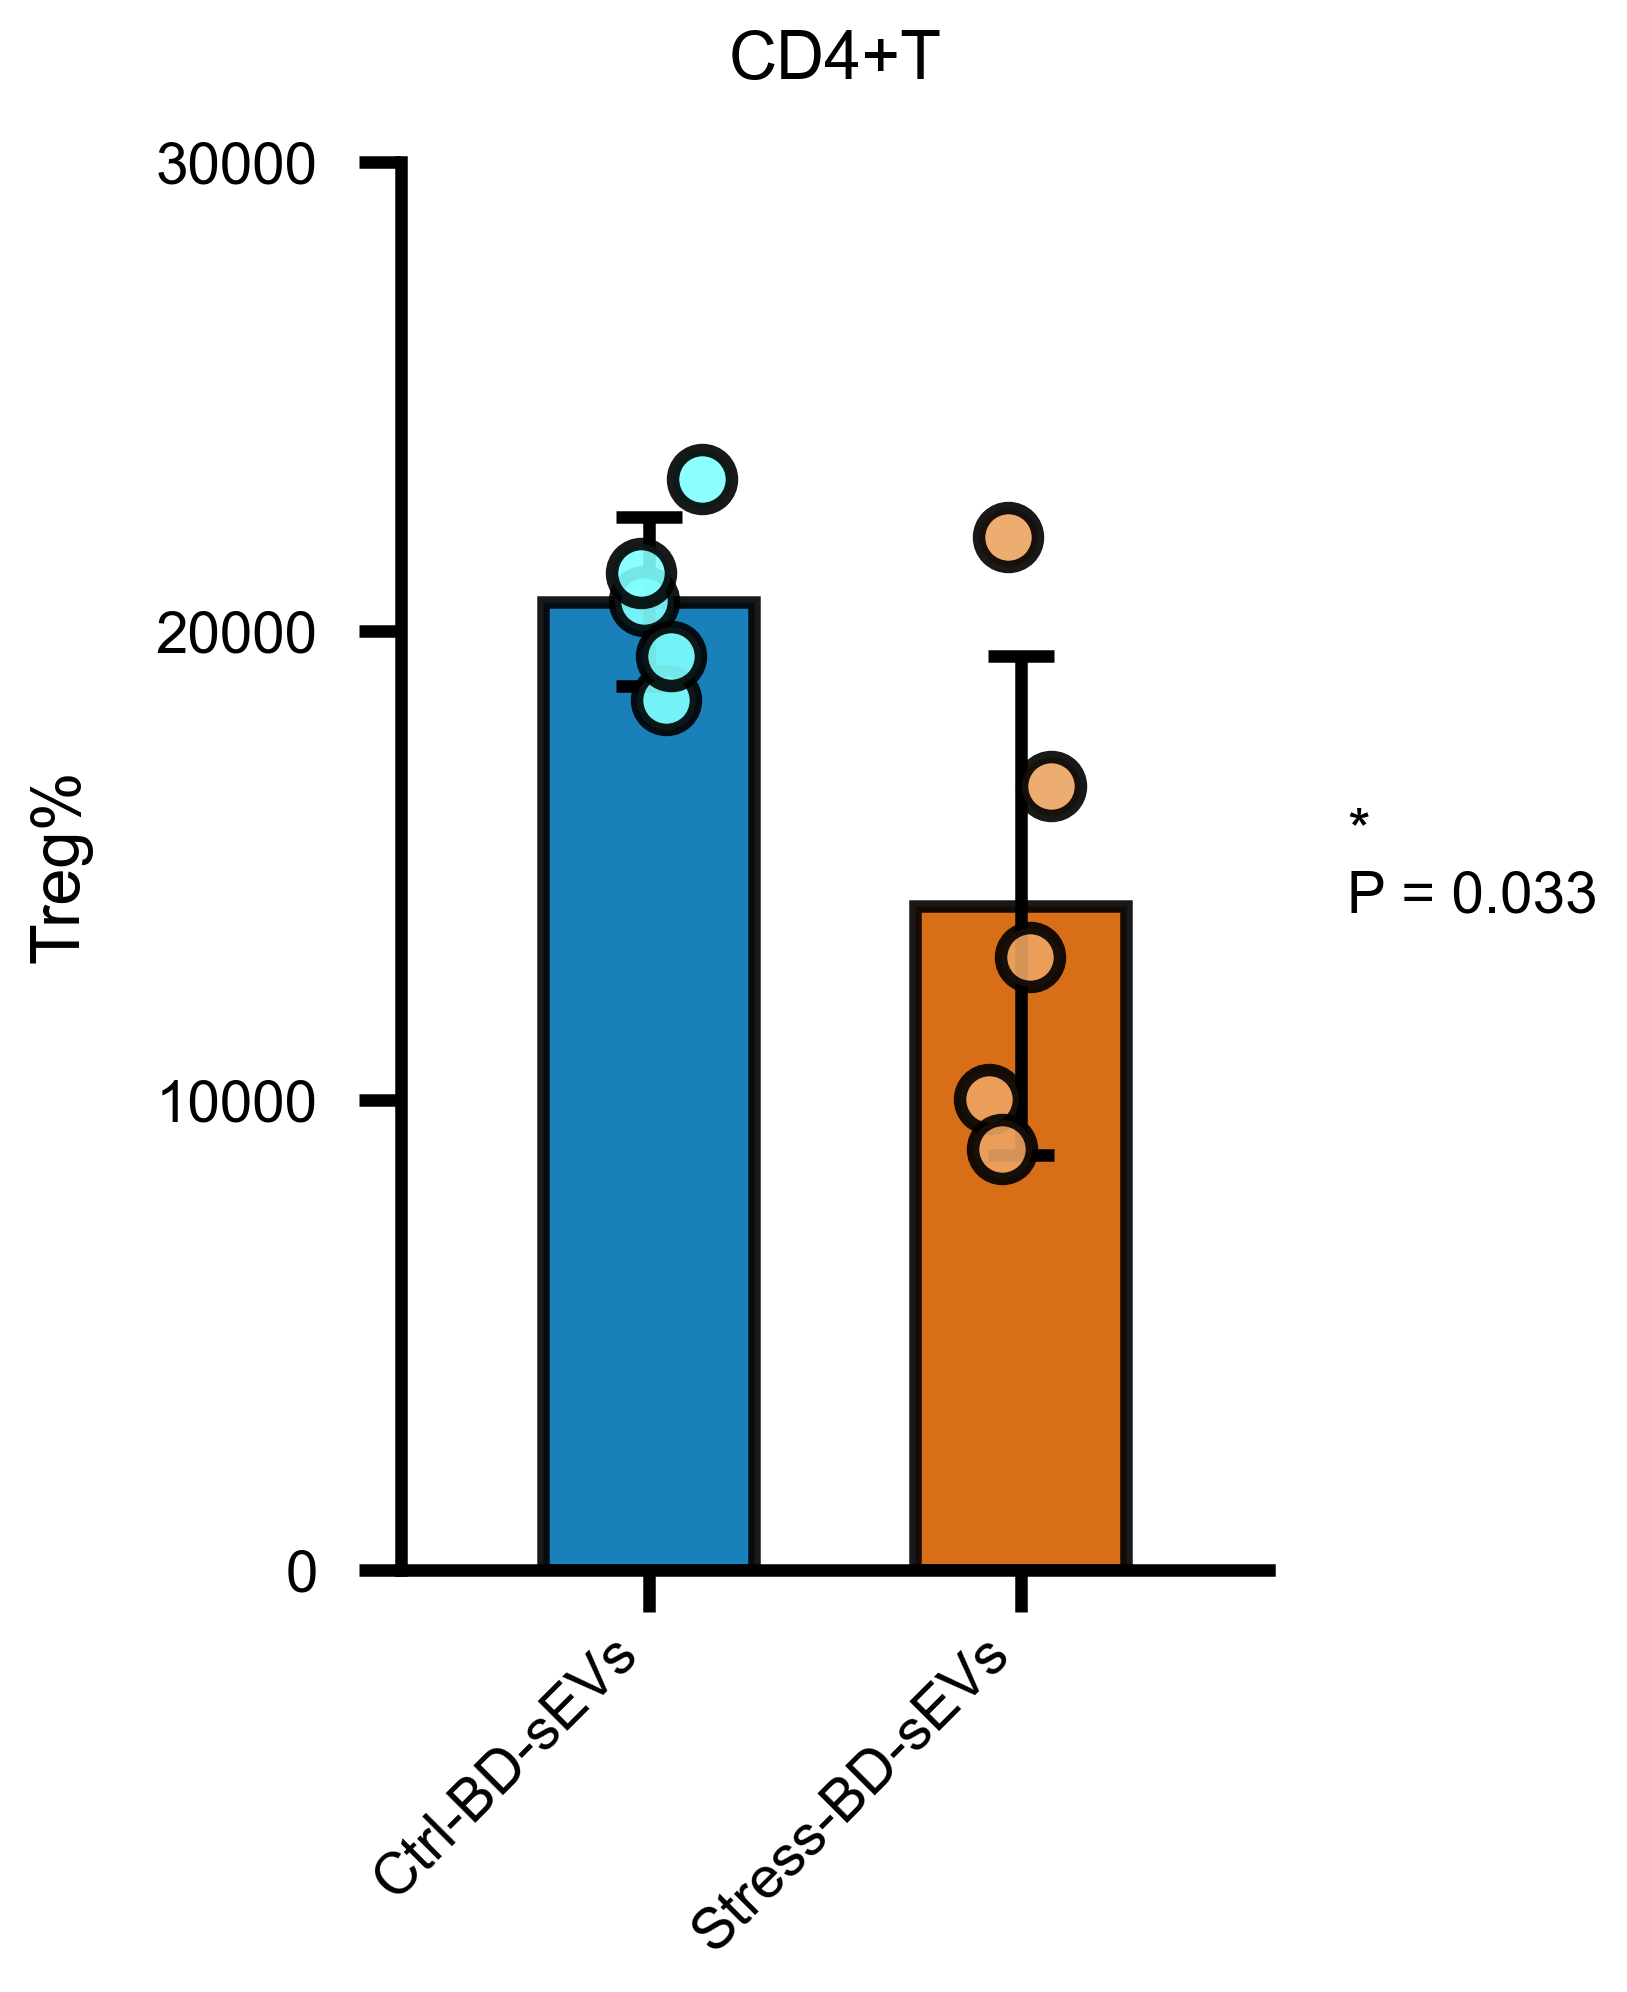
运行成功后,在示例 CSV 同目录得到 data_barplot.png:均值柱 + SD 误差线 + 抖动散点 + 显著性标注。
Step 4|换成你自己的数据
准备一张宽表 CSV:每列一个组、每行一个生物学重复(列名即组名;非数值列会被自动忽略)。输入 prompt:
My own data table is at: <paste the path to your CSV file here>.
1. First check my table: it should be WIDE format — one column per group, one row per
   biological replicate, column names are group names. Non-numeric columns are ignored
   automatically, but if there are unexpected non-numeric columns the skill may pick the
   wrong script — check for that and tell me what you found.
2. Tell me how many groups you detected (the skill auto-selects the 2/3/4/5/6-group script),
   and confirm the group names match my intention before plotting.
3. Run the skill's own script — do NOT write new analysis code from scratch. The figure is
   saved next to my input CSV as <input>_barplot.png.
4. Show me the figure and explain the statistics (t-test for 2 groups; ANOVA + Tukey HSD
   for ≥3 groups).
Step 5|让 AI 解读结果与自定义样式
输入 prompt:
Please explain my barplot figure in detail:
1. Which groups differ significantly and at what level (the meaning of the stars / letters);
2. Which statistical test was used and why it is appropriate for my group count;
3. Any warnings (e.g., very small sample sizes, outliers visible in the jittered points).

Then help me CUSTOMIZE the figure for my paper:
1. This skill's scripts are configured by editing the TOP of the selected script
   (FIGURE_NAME, Y_LABEL, bar_colors). Copy the script to a new file next to my data first,
   then edit ONLY that config block — my figure title should be <e.g., "ELISA"> and my Y-axis
   label should be <e.g., "IFNβ (pg/mL)">. Do NOT change anything else in the script.
2. The default colors are the Wong 2011 colorblind-safe palette; if I want the alternative
   palettes, use the barplot_2col_green_pink.py / barplot_3col_light.py variants (identical
   statistics).
3. Re-run and show me the customized figure.
阅读完 AI 的解释,如果有不懂的直接问它。
更多分析
本技能只做分组柱状图。下面几个技能与它相关,安装方式完全相同(一键 prompt 或网站下载 zip 包):
qPCR mRNA(ΔΔCt)—— qpcr-mrna | qPCR mtDNA 拷贝数 —— qpcr-mtdna
一句话:qPCR 原始 Ct 表进,ΔΔCt 相对表达量 / mtDNA 相对拷贝数的柱状图出——如果你画的是 qPCR 数据,这两个技能更省事(自动算 ΔΔCt / 拷贝数再画图)。
/zh/skills/qpcr-mrna | /zh/skills/qpcr-mtdna
临床统计表 —— clinical-table
一句话:患者级 CSV 进,论文 Table 1 基线特征表出。 分类变量 χ²/Fisher + 连续变量 t 检验,Markdown 三线表可一键转 DOCX。
详细介绍与下载:/zh/skills/clinical-table
生存分析曲线 —— survival-curve
一句话:随访表进,KM 生存曲线 + 风险表 + Cox 森林图出。 自动 maxstat 最优截点,600 dpi 发表级。
详细介绍与下载:/zh/skills/survival-curve