
Grouped Bar Plot
One-line: wide-format CSV in — publication-ready grouped bar plot out, with error bars, scatter points and significance annotations.
Get this skill · 获取本技能
Option A — one-click agent prompt (recommended). Copy this into your AI agent IDE:
Please set up the "barplot" skill from the Claw2Bio library for me:
1. Fetch only the folder "figure-generation/barplot" from the GitHub repo
   https://github.com/claw2bio/claw2bio (use sparse checkout; do not clone the whole repo).
2. Read its SKILL.md and register the skill.
3. Run the bundled example in examples/ to verify my environment, and show me the output figure.
Option B — standalone zip (few MB, Tencent COS direct link): coming soon — being packaged.
Option C — full example dataset (COS, per-skill folder): coming soon — being packaged.
What it does
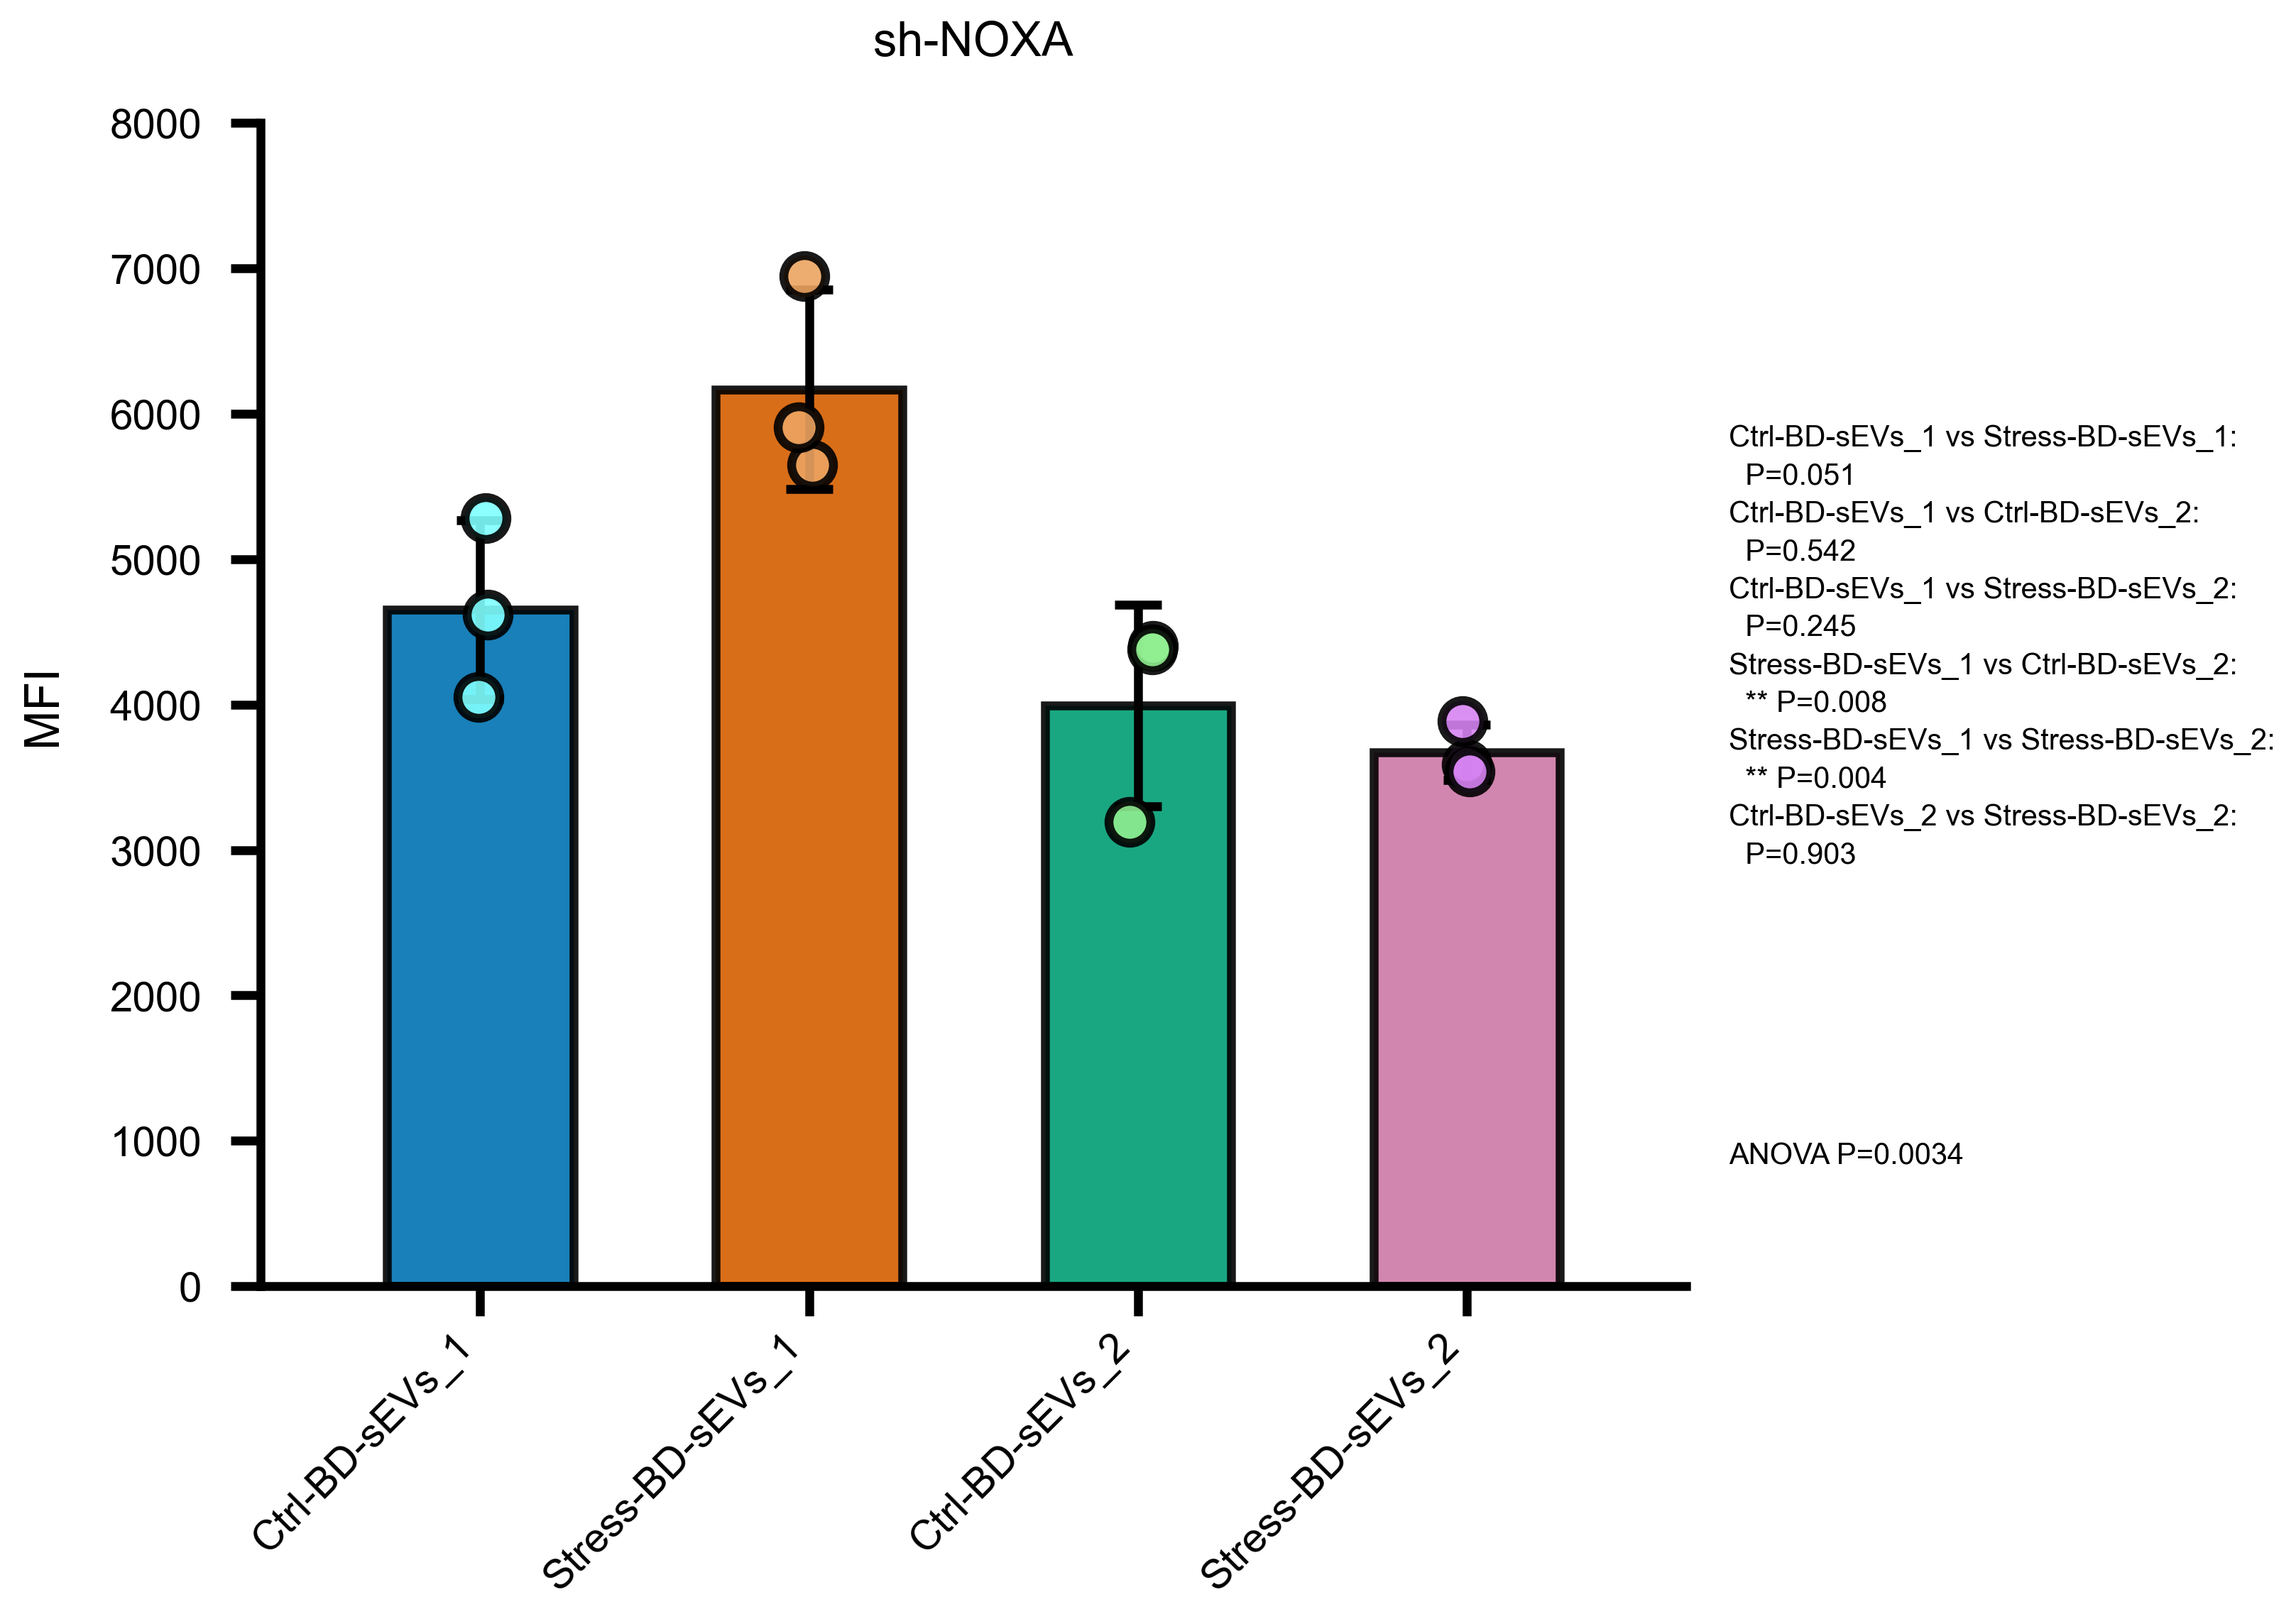
Counts the numeric columns in your CSV, auto-selects the matching 2/3/4/5/6-group script, and produces a 300-dpi PNG with mean, SD error bars, jittered replicate points and statistics (2 groups: t-test; ≥3 groups: ANOVA + Tukey HSD):
Quick start (30 seconds)
cd figure-generation/barplot
pip install pandas numpy scipy matplotlib statsmodels
python scripts/run_barplot.py examples/input/data.csv
The plot is saved next to the input as data_barplot.png.
Input format
Wide format — one column per group, one row per biological replicate:
Ctrl,Stress
18533,13055
20650,10017
19467,21995
Non-numeric columns are ignored automatically.
Output files
| File | Content |
|---|---|
<input>_barplot.png | 300-dpi grouped bar plot with statistics annotations |
Customization
Edit at the top of the selected script:
FIGURE_NAME = 'ELISA'
Y_LABEL     = 'IFNβ (pg/mL)'
bar_colors  = [...]   # Wong 2011 color-blind-friendly palette by default
Alternative palettes with identical statistics: barplot_2col_green_pink.py, barplot_3col_light.py.
Troubleshooting
- Wrong script picked → check for stray non-numeric header columns; or call the exact script directly.
- Labels cut off → the Y-axis auto-extends; if a custom range is needed, edit
Y_LABEL/axis settings in the script header.
Links
- Source & SKILL.md on GitHub
- Related skills: qPCR mRNA · Clinical tables