
Zero-Basics — Plotting Expression of Specific Genes with an AI Agent (RNA-seq-gene-plot) | Copy & Paste All the Way
This tutorial uses workbuddy as the AI agent and Hy3 as the AI API. For installing and configuring the AI agent itself, see the AI Agent setup tutorial.
Before you start (must read):
- If this is your first time doing bioinformatics with an AI agent, we strongly recommend following the bulk-RNA-seq differential analysis tutorial first, to learn the full "install skill → set up environment → run example → switch to your own data" workflow, then come back to this skill.
- This skill is a downstream skill of bulk-RNA-seq: it consumes the normalized expression matrix (
normalized_expression.csv) and the metadata table (sample_metadata.csv) produced by the bulk-RNA-seq pipeline. Please finish the bulk-RNA-seq tutorial and keep its output folder. - In one sentence: pull a single gene out of the normalized matrix and plot it — how abundantly a gene is expressed across groups, or which of two genes is higher within the same group, with error bars, jittered points, and statistics. Its only dependency is ggplot2, making it one of the lightest skills in the library.
Tutorial structure:
- Step 1 | Install the RNA-seq-gene-plot skill (one time only)
- Step 2 | Set up the runtime environment (one time only)
- Step 3 | Run the bundled example data
- Step 4 | Switch to your own data
- Step 5 | Read the REPORT.md
- More analysis | Related downstream skills (enrichment / GSEA)
Step 1 | Install the RNA-seq-gene-plot skill
Paste this prompt:
Please install the "RNA-seq-gene-plot" skill for me, into the D:\claw2bio folder:
1. Create a folder named claw2bio in the root of the D: drive (if it doesn't exist yet).
2. From the GitHub repository https://github.com/nihuanhe/claw2bio, fetch ONLY the folder
   bioinformatics/bulk_RNA_seq/RNA-seq-gene-plot (use sparse checkout — do NOT clone the whole
   repository), and place it at D:\claw2bio\RNA-seq-gene-plot.
3. If downloading from GitHub fails or is too slow, download the zip from this mirror link instead:
   https://claw2bio.site/downloads/RNA-seq-gene-plot.zip
   and extract it to D:\claw2bio\RNA-seq-gene-plot.
4. Read the SKILL.md inside, then confirm to me that the skill is ready and list the contents
   of the folder.
(If my PC has no D: drive, install to C:\claw2bio instead and tell me the actual path.)
When Step 1 finishes, open the file manager and confirm that D:\claw2bio\RNA-seq-gene-plot exists, with scripts/, examples/, SKILL.md, etc. inside.
Step 2 | Set up the runtime environment
This skill only needs R + ggplot2. If you already installed R while following the bulk-RNA-seq tutorial, this step is very quick. Paste this prompt:
Please set up the runtime environment for the "RNA-seq-gene-plot" skill at
D:\claw2bio\RNA-seq-gene-plot:
1. R should already be installed from the bulk-RNA-seq tutorial — verify that R is installed
   and report its version to me (it must be 4.5 or above). If R is missing, stop and tell me.
2. This skill only needs ggplot2 (statistics use base R). Check whether ggplot2 is installed;
   if not, install it from CRAN.
3. When everything is ready, confirm to me that the skill can run.
Step 3 | Run the bundled example data
Paste this prompt:
The skill is installed at D:\claw2bio\RNA-seq-gene-plot. Please run the bundled example:
1. Example input is at D:\claw2bio\RNA-seq-gene-plot\examples\input\ (normalized_expression.csv
   and sample_metadata.csv).
2. Write results to D:\claw2bio\RNA-seq-gene-plot\examples\output\
3. Plot the genes Trp53 and Gapdh, with Control as the control group.
4. Prefer the skill's own scripts in scripts/ — do NOT write new analysis code from scratch.
5. When the run succeeds, show me both result figures: the per-gene across-group barplot and
   the within-group two-gene comparison plot; then explain the generated REPORT.md line by line.
When the run succeeds, you should see two kinds of plots (examples shown below; replace with your own screenshots later):
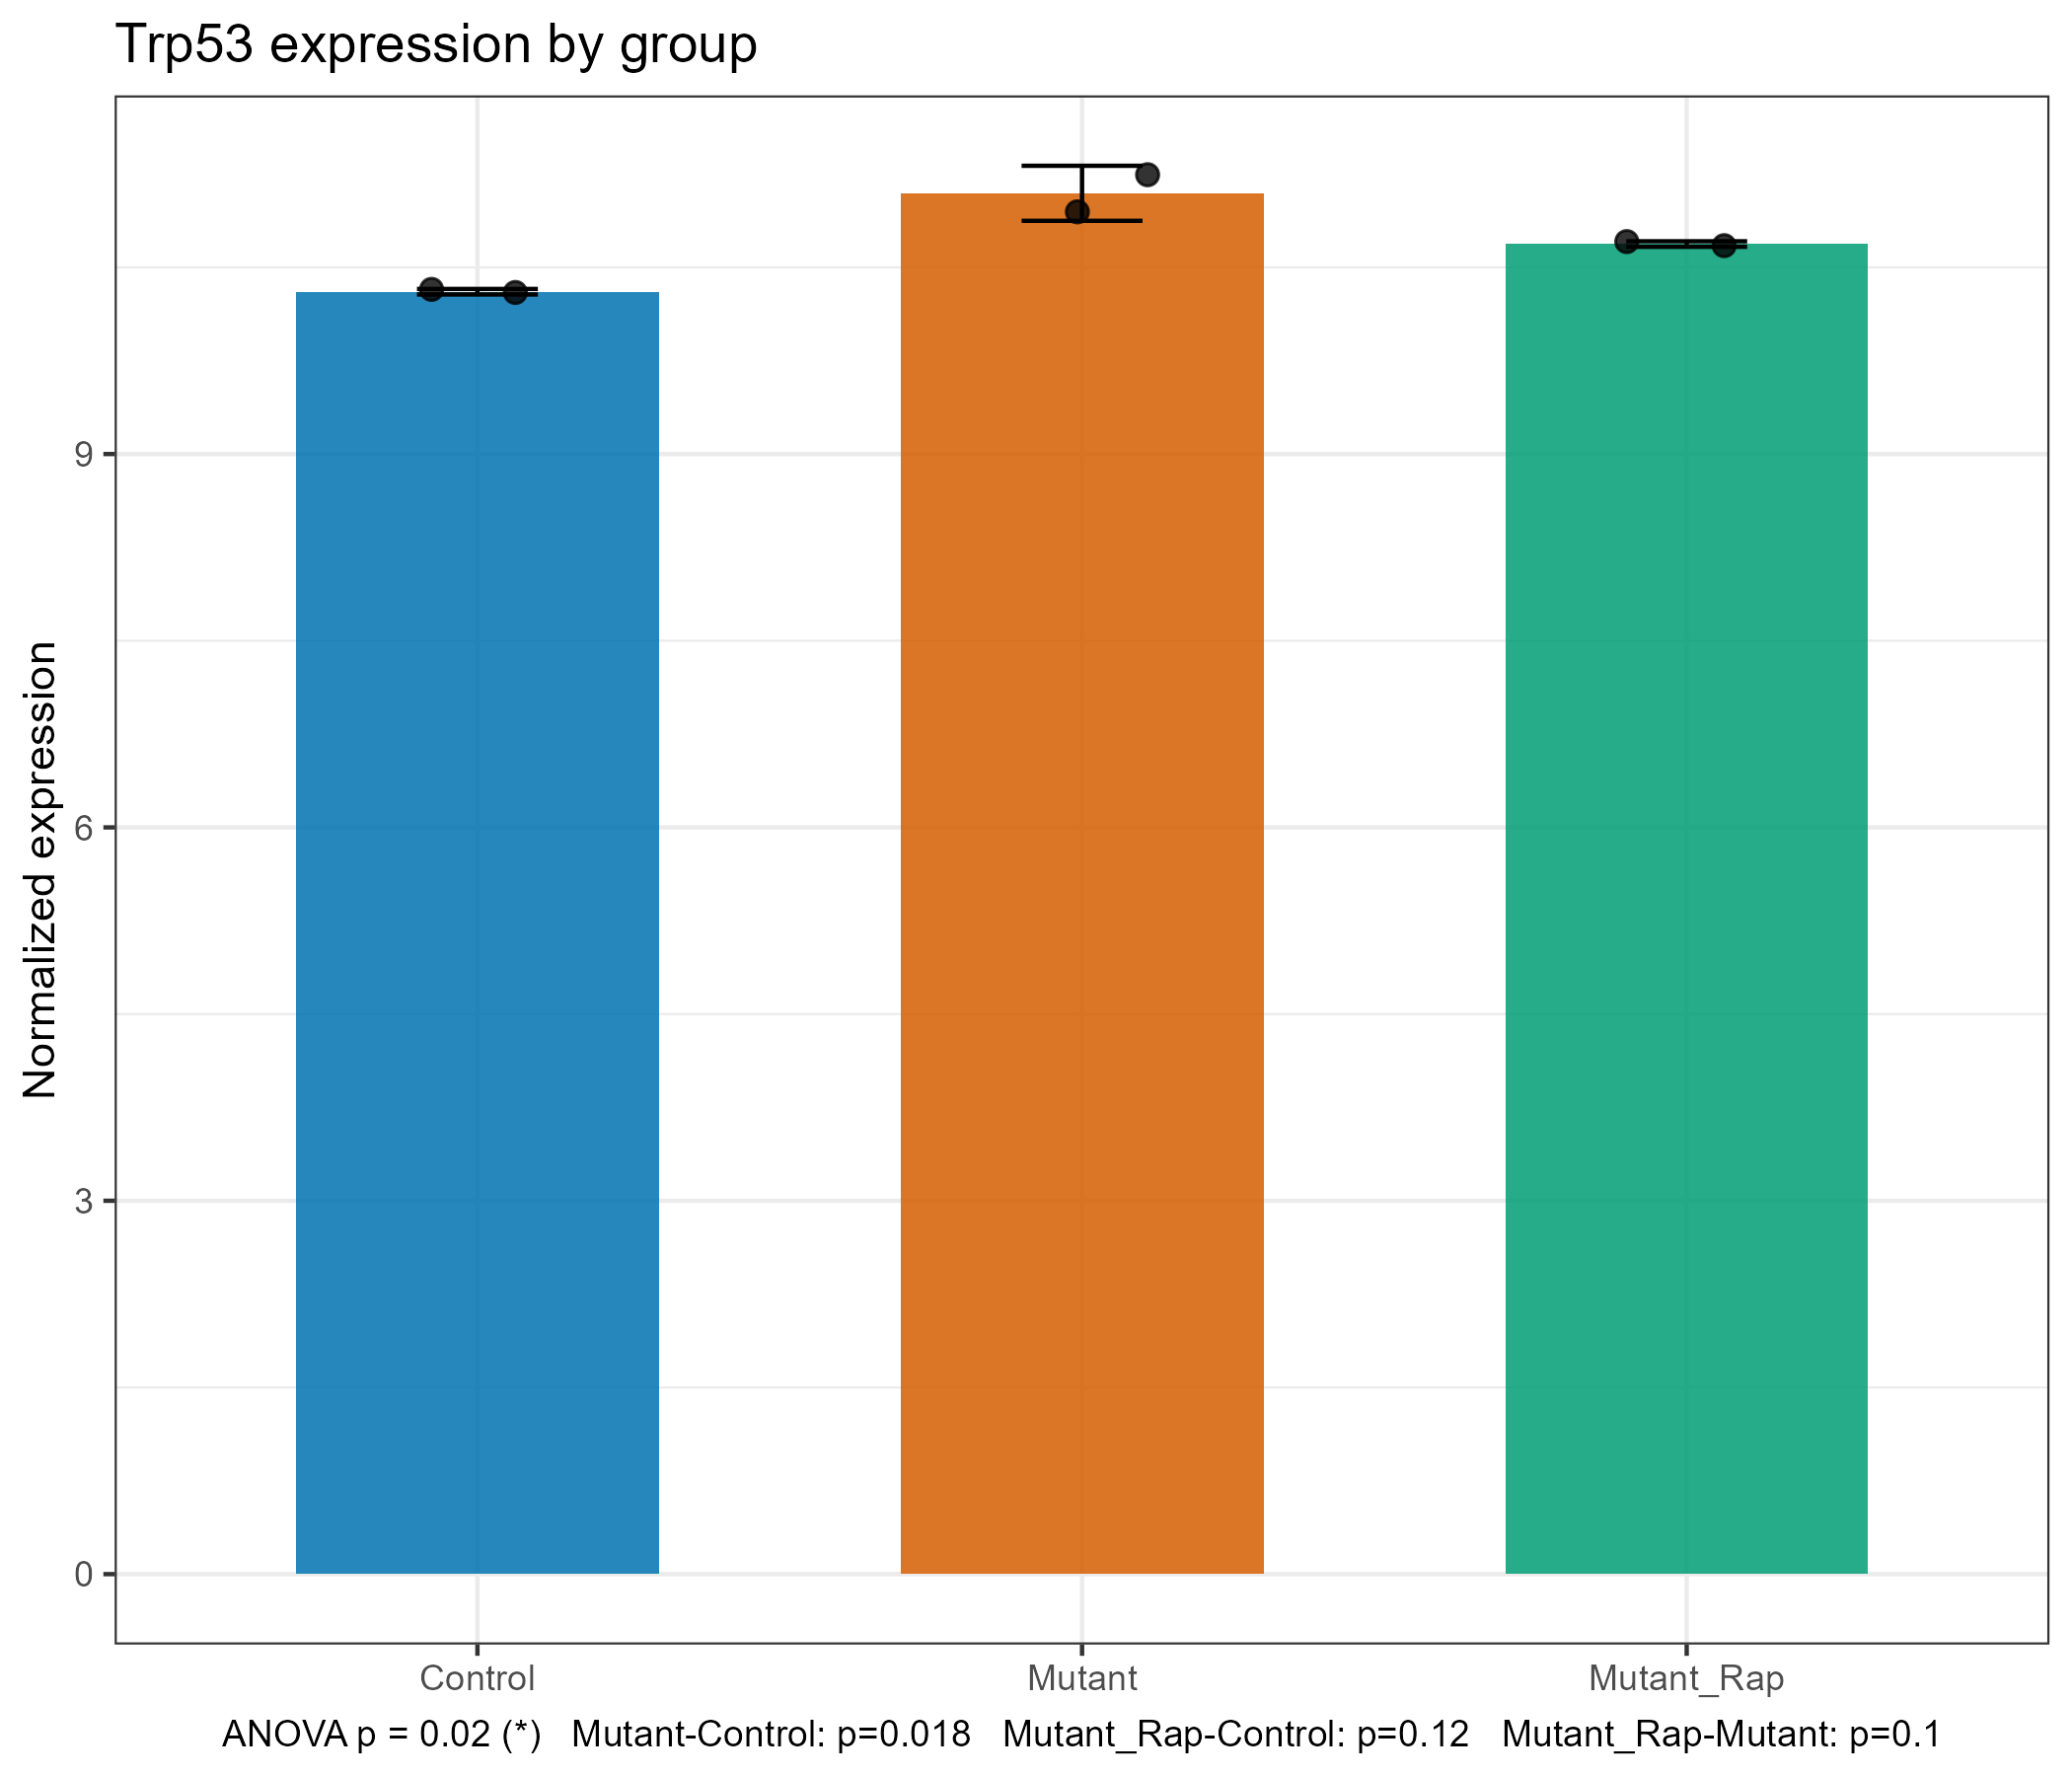
A gene's expression across groups (mean ± SD + jittered points + significance labels):
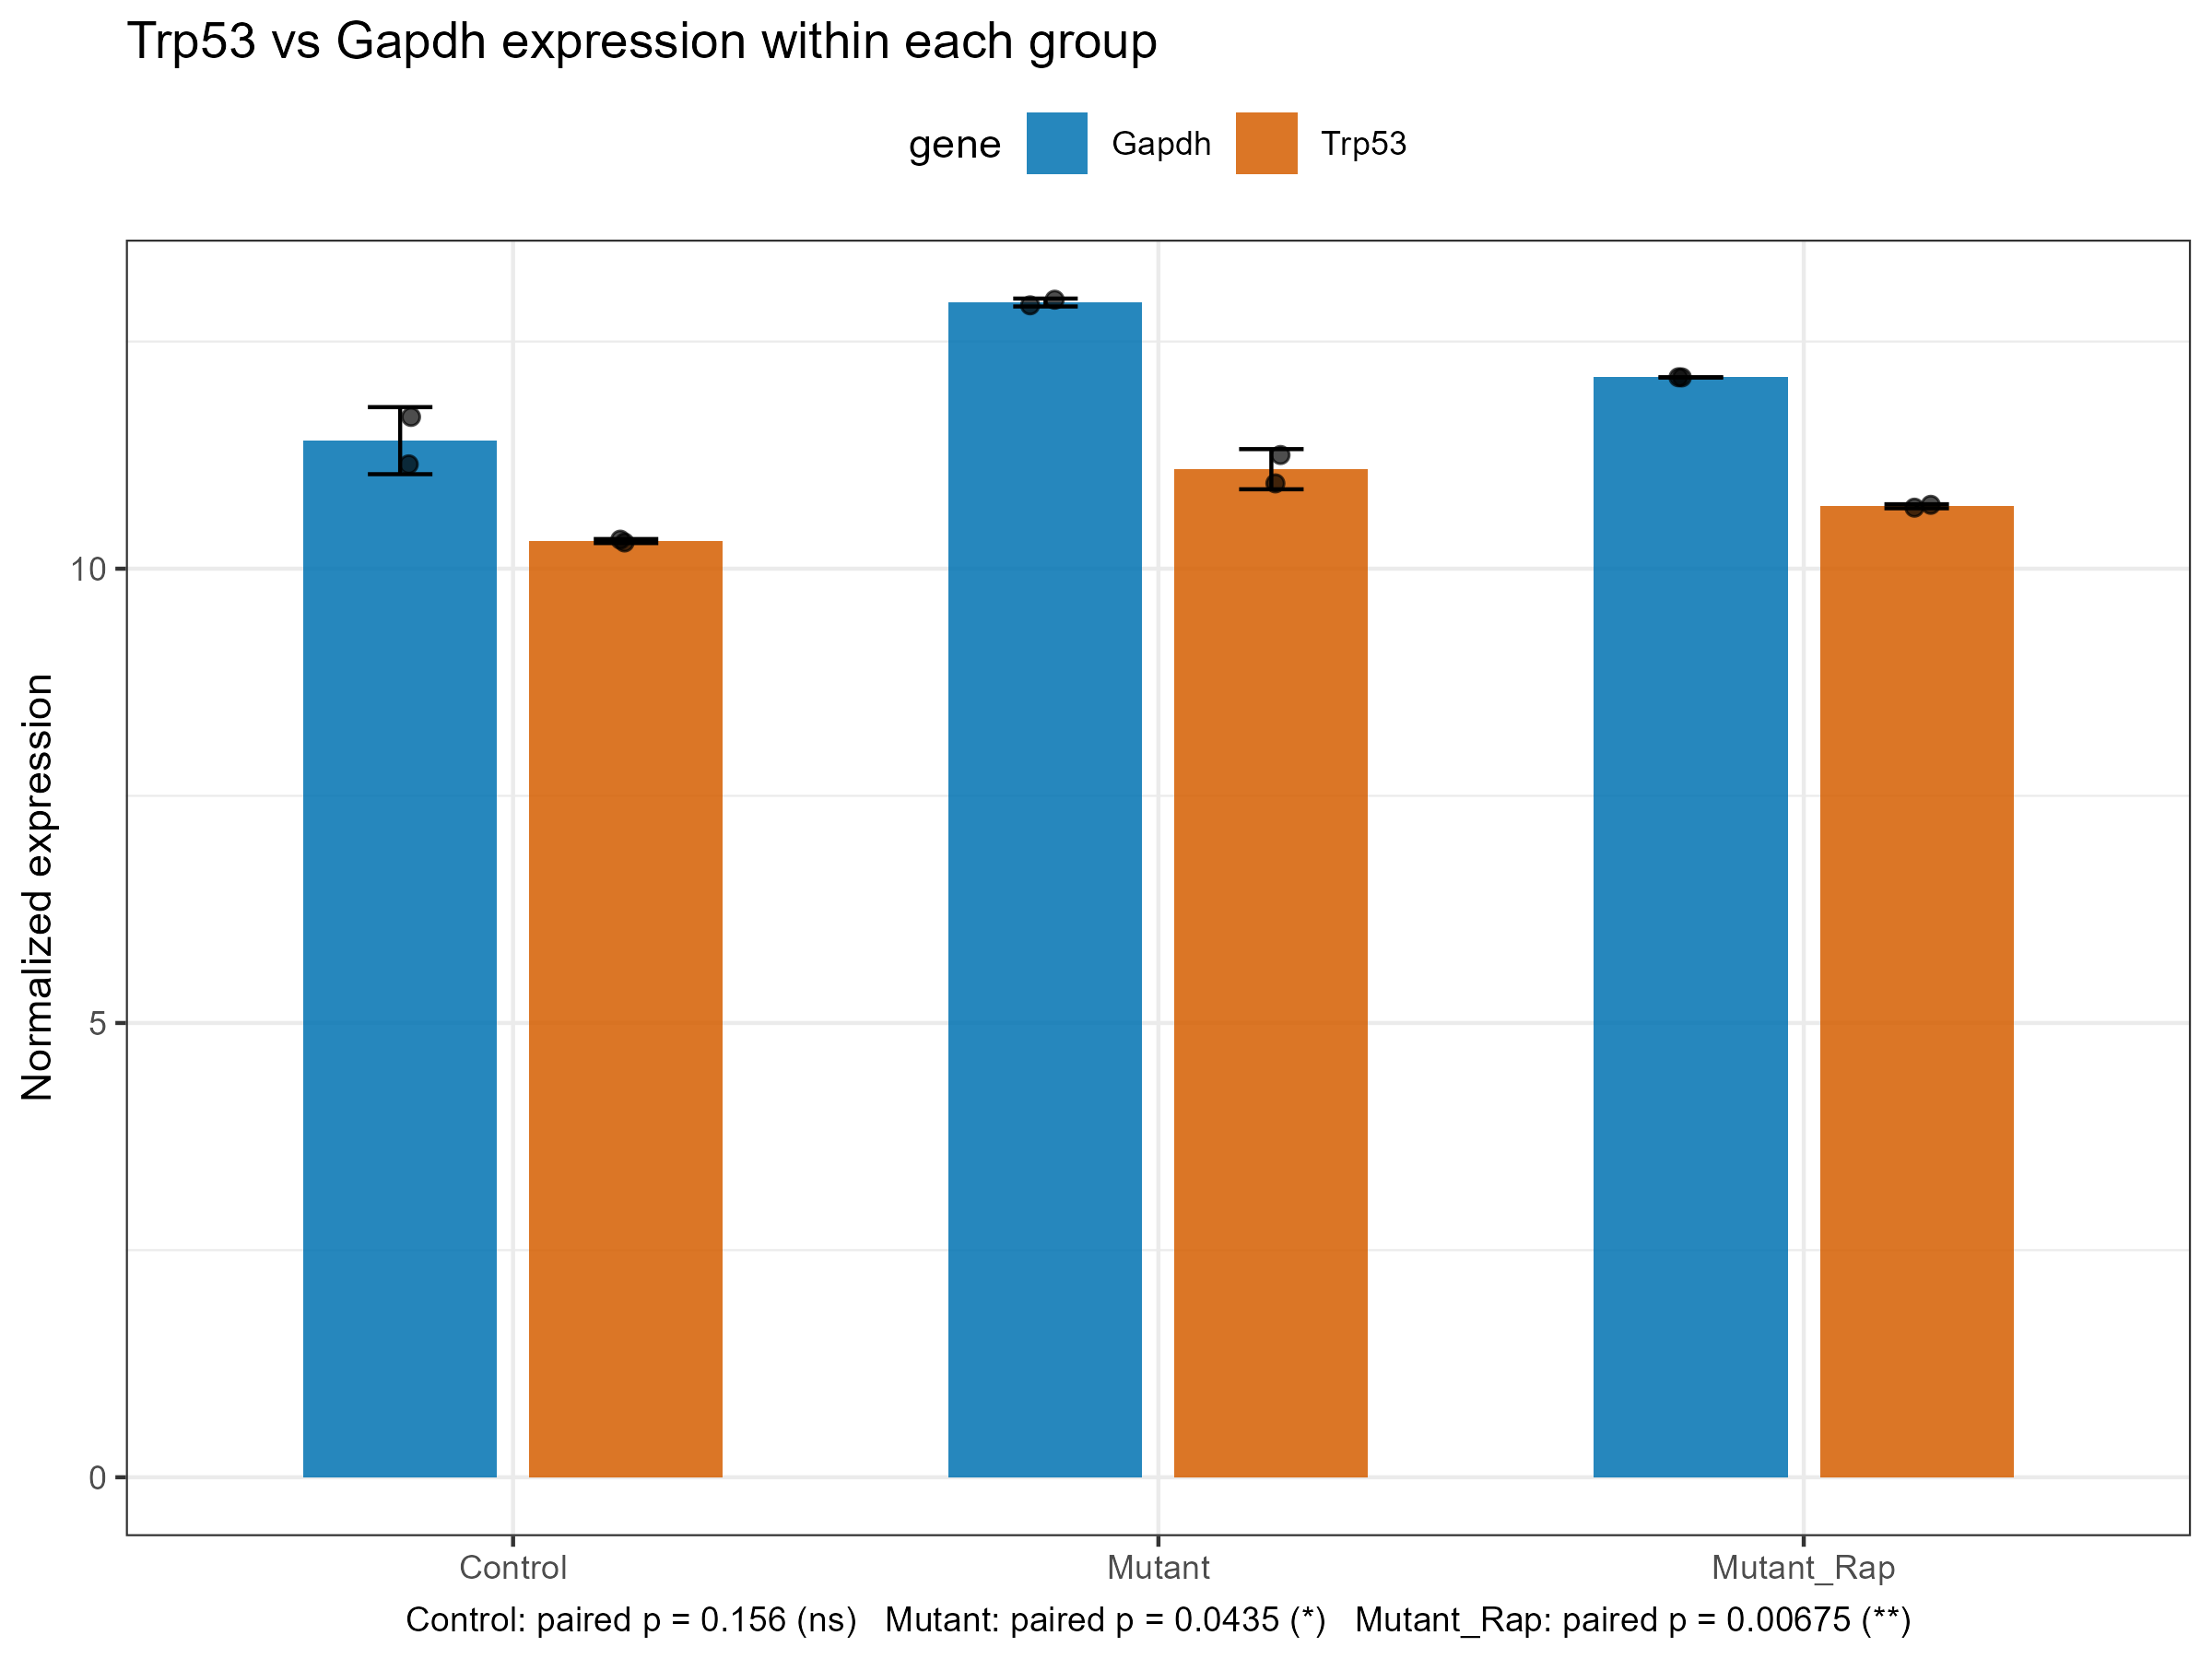
Paired comparison of two genes within the same group (paired t-test):
Step 4 | Switch to your own data
Hand over your own bulk-RNA-seq output folder (it should contain the normalized matrix and metadata table). Paste this prompt:
My own bulk-RNA-seq results are at: <paste the path to your bulk-RNA-seq output folder here —
it should contain normalized_expression.csv and sample_metadata.csv>.
Please plot the expression of these genes: <write your genes here, e.g., Trp53,Myc,Gapdh —
use the species-correct spelling: all-caps for human like TP53, first-letter-capitalized for
mouse like Trp53>.
1. First check whether my matrix and metadata have any format problems (e.g., sample names not
   matching between the two files); if so, fix them and tell me what you did.
2. Use Control as the control group for group ordering; if my control group has a different
   name, ask me first.
3. Prefer the skill's own scripts in scripts/; if anything needs adapting, make the smallest
   possible change — do NOT write large amounts of new code.
4. Show me the across-group barplot for each gene and, if I gave you 2 or more genes, the
   within-group comparison plot as well.
Wait for the AI agent to finish: one across-group barplot per gene (t-test for 2 groups, ANOVA + Tukey for ≥3 groups, with the statistical method noted in the caption), plus a within-group paired comparison plot when you provide 2 or more genes.
Step 5 | Read the REPORT.md
Ask the AI to interpret your results:
Please explain the REPORT.md in my gene-plot results folder line by line:
1. What each output file is and what it contains (the PNG/PDF figures and the numeric CSVs);
2. For each gene I plotted: which groups differ significantly, and which statistical test was
   used and why;
3. Any warnings or things I should pay attention to (e.g., a gene not found, or filtered out
   by low-expression filtering upstream).
After explaining, tell me which figures can be used directly in a paper or presentation.
After reading the AI's explanation, if anything is unclear, just ask it directly.
More analysis
This skill only plots expression comparisons for specific genes. The two skills below are sibling downstream skills, installed in exactly the same way (one-click prompt or zip download from the website), and both consume the bulk-RNA-seq output:
Enrichment analysis (GO / KEGG / Reactome) — RNA-seq-enrichment
One sentence: DEG tables in, GO / KEGG / Reactome enrichment tables and dotplots out. Each comparison is automatically split into up-/down-regulated gene sets, producing one table and one dotplot per direction per pathway database — works offline.
Details & download: /skills/RNA-seq-enrichment
GSEA — RNA-seq-GSEA
One sentence: enrichment without thresholds, using the full ranked gene list. Runs fgsea against MSigDB-format GMT gene sets, with a built-in Reactome demo gene set that works out of the box.
Details & download: /skills/RNA-seq-GSEA