
Zero-Basics — Drawing Publication-Grade Phylogenetic Trees with an AI Agent (phylo-tree-plot) | Copy & Paste All the Way
This tutorial uses workbuddy as the AI agent and Hy3 as the AI API. For installing and configuring the AI agent itself, see the AI Agent setup tutorial.
Before you start (must read):
- If this is your first time doing bioinformatics with an AI agent, we strongly recommend following the bulk-RNA-seq differential analysis tutorial first, to learn the full "install skill → set up environment → run example → switch to your own data" workflow, then come back to this skill.
- In one sentence: treefile + annotation table in, publication-grade annotated tree figure out — midpoint rooting, branches colored by group, one annotation ring per column (automatic colors), a separate legend grid below the tree, 600 dpi PNG + font-embedded PDF.
- This skill directly consumes the
.treefileproduced by phylo-tree-build, but any Newick-format tree file works. - Good news: this skill runs in Windows R directly — no WSL needed (WSL is only needed for tree BUILDING, not plotting).
- This skill is a template script (not a CLI): switching to your own data means copying the template and editing the CONFIG block at the top — don't worry, the Step 4 prompt makes the AI do it for you.
Tutorial structure:
- Step 1 | Install the phylo-tree-plot skill (one time only)
- Step 2 | Set up the runtime environment (one time only)
- Step 3 | Run the bundled example data
- Step 4 | Switch to your own data
- Step 5 | Read the REPORT.md
- More analysis | Companion skill (tree building)
Step 1 | Install the phylo-tree-plot skill
Paste this prompt:
Please install the "phylo-tree-plot" skill for me, into the D:\claw2bio folder:
1. Create a folder named claw2bio in the root of the D: drive (if it doesn't exist yet).
2. From the GitHub repository https://github.com/nihuanhe/claw2bio, fetch ONLY the folder
   bioinformatics/phylo-tree/phylo-tree-plot (use sparse checkout — do NOT clone the whole
   repository), and place it at D:\claw2bio\phylo-tree-plot.
3. If downloading from GitHub fails or is too slow, download the zip from this mirror link instead:
   https://claw2bio.site/downloads/phylo-tree-plot.zip
   and extract it to D:\claw2bio\phylo-tree-plot.
4. Read the SKILL.md inside, then confirm to me that the skill is ready and list the contents
   of the folder.
(If my PC has no D: drive, install to C:\claw2bio instead and tell me the actual path.)
When Step 1 finishes, open the file manager and confirm that D:\claw2bio\phylo-tree-plot exists, with scripts/, examples/, SKILL.md, etc. inside.
Step 2 | Set up the runtime environment
If you already installed R (4.5 or above) while following the bulk-RNA-seq tutorial, this step mainly adds the plotting-specific R packages. Paste this prompt:
Please set up the runtime environment for the "phylo-tree-plot" skill at
D:\claw2bio\phylo-tree-plot:
1. R should already be installed from the bulk-RNA-seq tutorial — verify that R is installed
   and report its version to me (it must be 4.1 or above; 4.5+ recommended). If R is missing,
   stop and tell me.
2. Install all R packages this skill needs: ggtree, treeio, ggplot2, ggnewscale, RColorBrewer,
   viridis, cowplot, phytools. NOTE: ggtree and treeio come from BIOCONDUCTOR (use
   BiocManager::install), the rest from CRAN. If any package fails or is too slow, stop and
   tell me about it.
3. When everything is installed, confirm to me that the skill can run.
When Step 2 finishes, the AI agent will tell you whether all dependencies are installed.
Step 3 | Run the bundled example data
Paste this prompt:
The skill is installed at D:\claw2bio\phylo-tree-plot. Please run the bundled example:
1. Run the template script as-is: Rscript scripts/plot_tree_template.R — it auto-locates the
   example treefile and annotation CSV.
2. Prefer the skill's own scripts in scripts/ — do NOT write new analysis code from scratch.
3. When the run succeeds, show me the output figure (600 dpi PNG), and the console anchor
   lines (they should report "tips: 12" and the ring levels). Then explain the generated
   REPORT.md line by line.
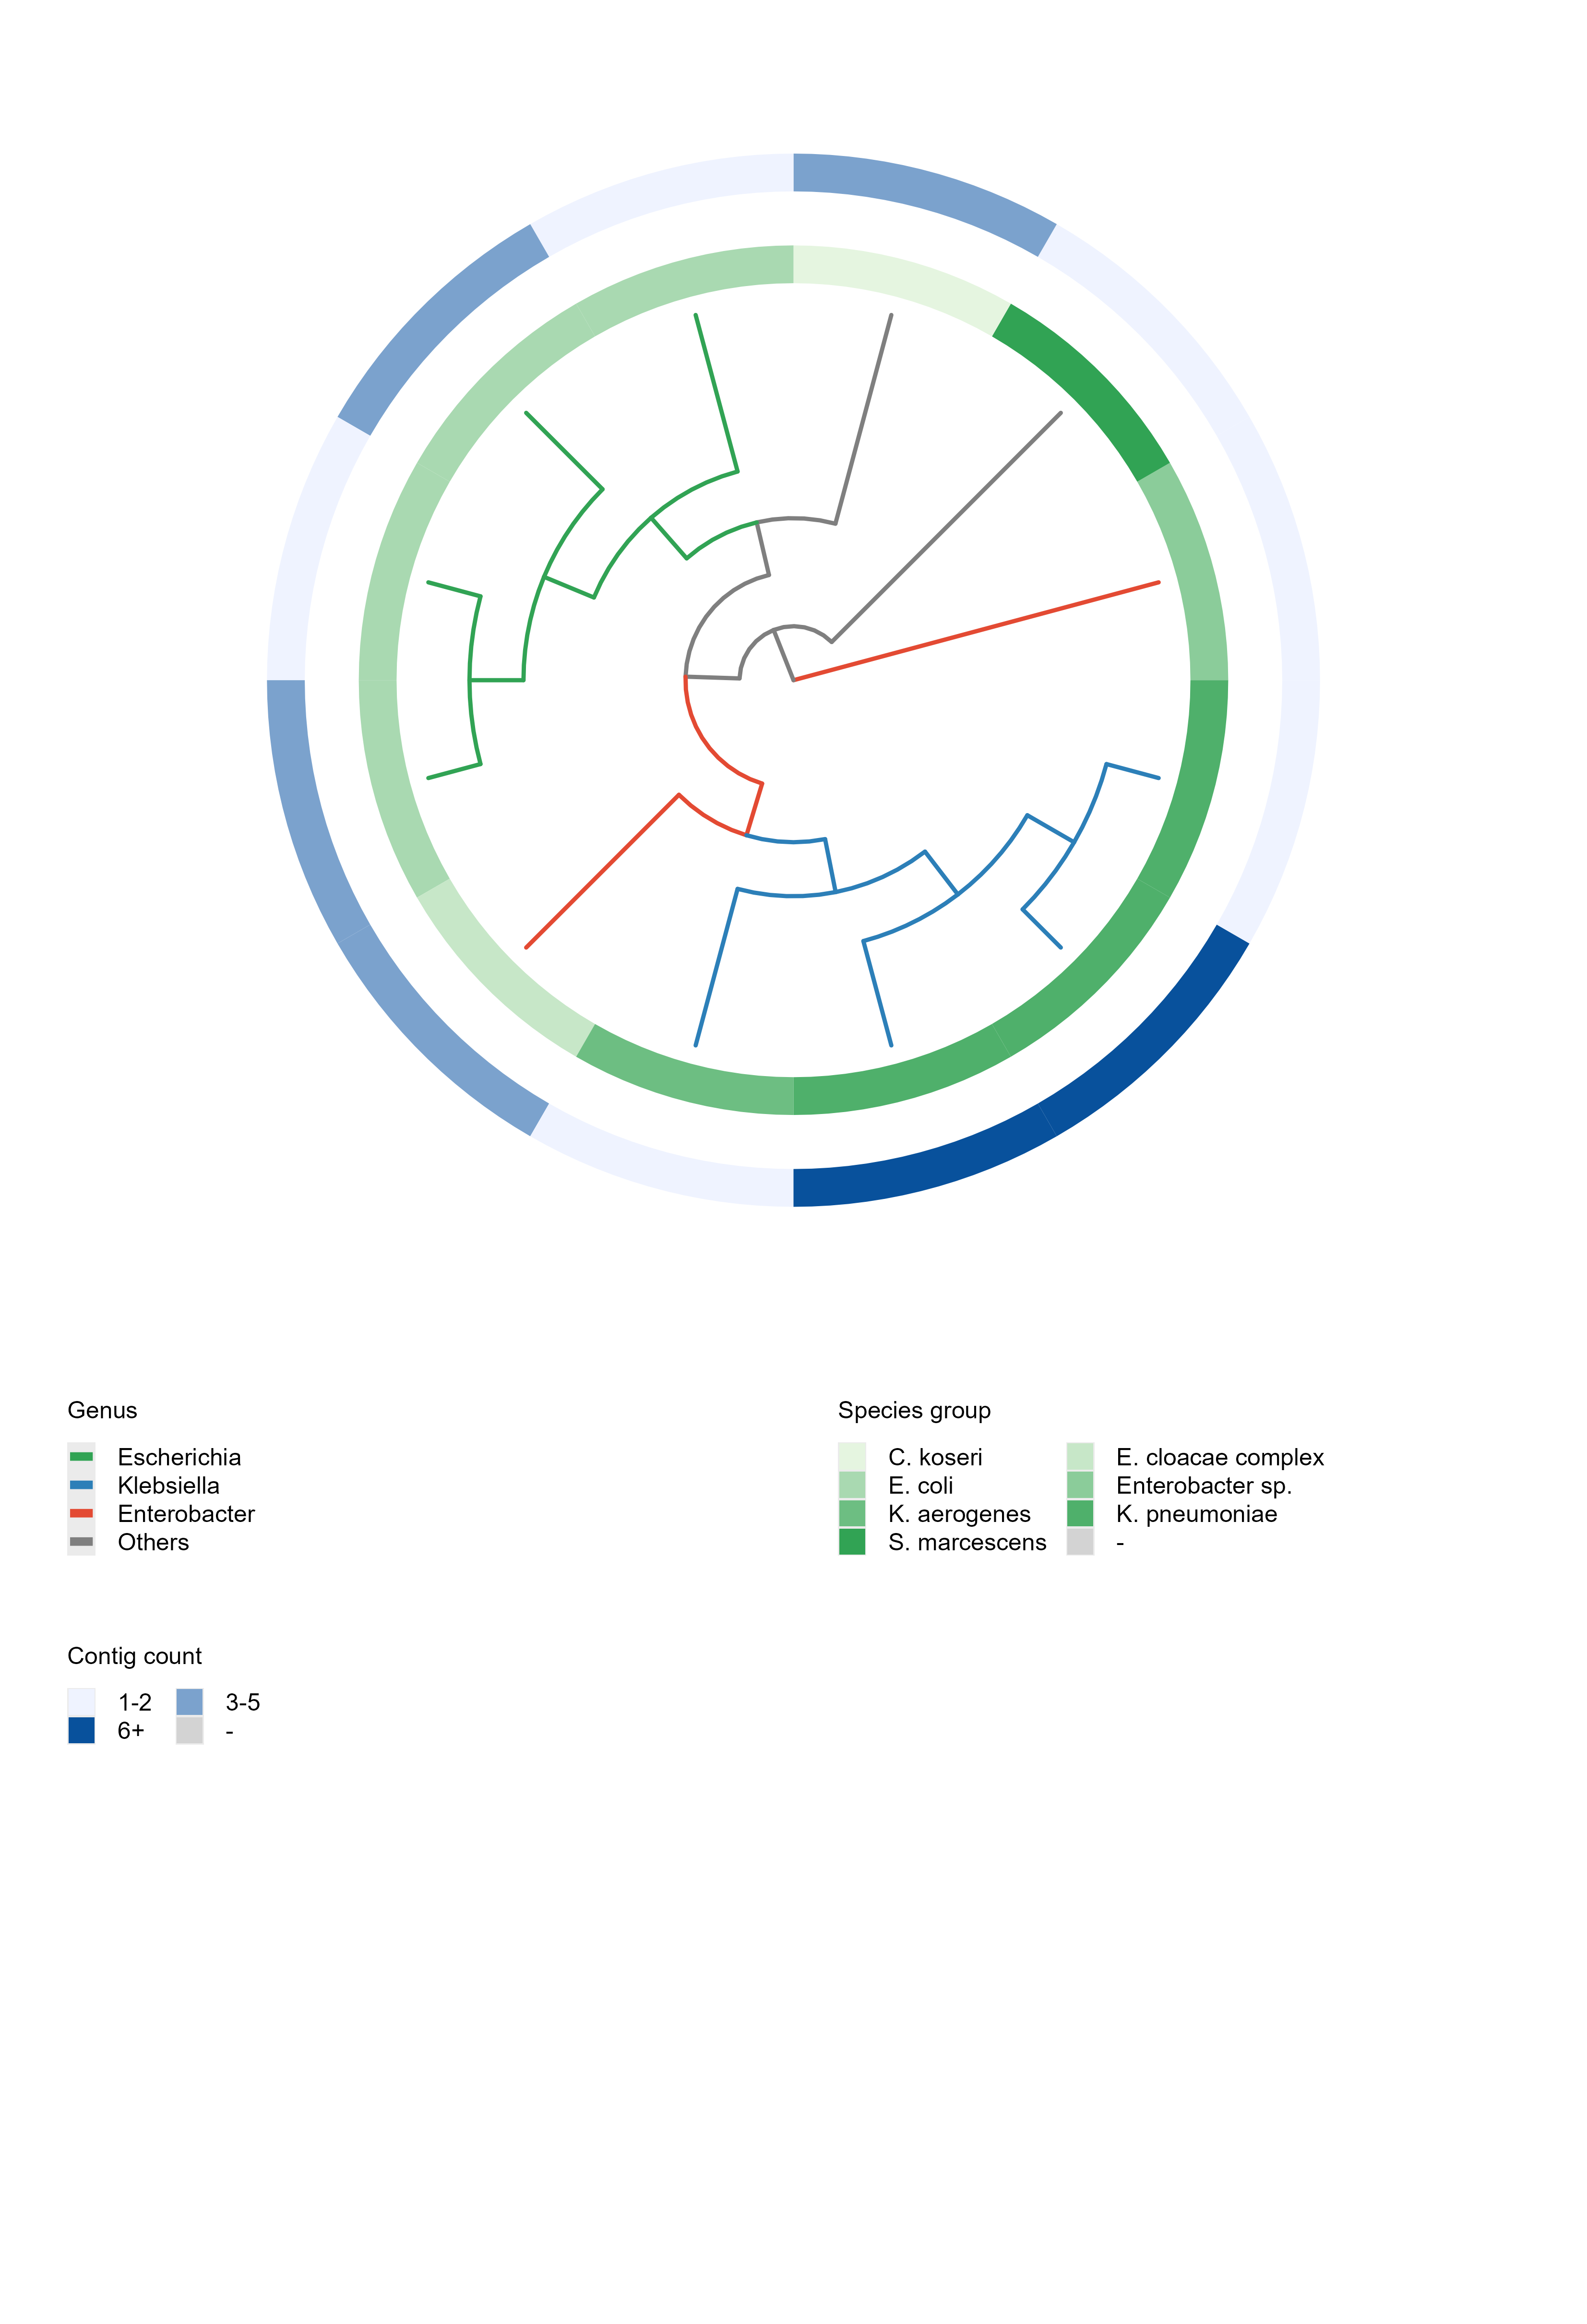
When the run succeeds, you should see a tree figure with annotation rings and a legend grid (example: a tree built by phylo-tree-build from 12 public NCBI genomes, annotated with species metadata; console anchor tips: 12):
Step 4 | Switch to your own data
Prepare two things:
- Tree file: Newick format, tip labels = sample IDs (phylo-tree-build output satisfies this natively);
- Annotation CSV: must have a header; first column
SampleIDmatching the tree tip labels one-to-one; remaining columns are any categorical annotations (bin continuous values first — each distinct value gets its own color); fill empty cells with-(drawn as grey).
Paste this prompt:
My own tree file is at: <paste the path to your .treefile / .nwk file here>.
My annotation CSV is at: <paste the path to your annotation CSV here>.
1. First check my inputs: the tree is valid Newick; every tip label appears EXACTLY once in
   the SampleID column of my CSV (the skill's stopifnot check will fail loudly otherwise —
   never silently drop tips); annotation columns are categorical (if a column is continuous,
   suggest binning it first; if a column has more than ~30 distinct values, warn me that the
   colors will be unreadable and suggest binning or dropping it); empty cells are filled
   with "-". If there are problems, fix them and tell me what you did.
2. This skill is a TEMPLATE script, not a CLI: copy scripts/plot_tree_template.R to a new file
   next to my data, then edit ONLY the CONFIG (EDIT THIS BLOCK) section at the top — set
   TREEFILE and ANN_CSV to my files, set GROUP_COL to <the column for branch coloring>, set
   RING_COLS to <the columns to draw as annotation rings>, and LAYOUT to <circular /
   rectangular>. Do NOT change anything outside the CONFIG block, and do NOT write new
   analysis code from scratch.
3. Run the edited script, then show me the output figure and explain the REPORT.md line by line.
4. If the rings look too thin or overlap, adjust ONLY RING_GAP / RING_WIDTH / TREE_H_CM in the
   CONFIG block and re-run.
Wait for the AI agent to finish: a 600 dpi PNG + cairo PDF with annotation rings and legend grid, plus standalone legend PNGs for reuse.
Step 5 | Read the REPORT.md
Paste this prompt:
Please explain the REPORT.md in my tree-plot results folder line by line:
1. What each output file is and what it contains (the main figure PNG/PDF, the standalone
   legend PNGs);
2. Walk me through MY tree figure: which clades group together, how the branch colors and
   each annotation ring should be read, and whether the groupings match the metadata
   (e.g., do same-group tips cluster together?);
3. Any warnings or things I should pay attention to.
After explaining, tell me which files can be used directly in a paper or presentation
(the PDF is vector with embedded fonts, best for journals; the 600 dpi PNG is best for
slides).
After reading the AI's explanation, if anything is unclear, just ask it directly.
More analysis
This skill only draws the figure. If you don't have a tree file yet, build one with the companion skill, installed in exactly the same way (one-click prompt or zip download):
Phylogenetic tree building — phylo-tree-build
One sentence: a folder of genome fasta files in, a Newick tree file out. bcgTree core-genome concatenation + IQ-TREE2 automatic model selection + 1000 ultrafast bootstraps; scripts from a published 67-strain CRE study. Note: building requires WSL2 + Ubuntu 24.04.
Details & download: /skills/phylo-tree-build