
Zero to DEG: Bulk RNA-seq Differential Analysis with an AI Agent | Pure Copy-Paste
This tutorial uses WorkBuddy as the AI agent and Hy3 as the AI API.
Tutorial roadmap:
- Step 1 | Install the bulk-RNA-seq skill (one-time)
- Step 2 | Set up the runtime environment (one-time)
- Step 3 | Run the bundled example data
- Step 4 | Switch to your own data
- Step 5 | Read the REPORT.md
- Step 6 | More than 2 groups? You pick the comparisons for DEG
- More analyses | Downstream skills (enrichment / gene-expression plots)
Step 1 | Install the bulk-RNA-seq skill
Type in the "Install the bulk-RNA-seq skill" prompt:
Please install the "bulk-RNA-seq" skill for me, into the D:\claw2bio folder:
1. Create a folder named claw2bio in the root of the D: drive (if it doesn't exist yet).
2. From the GitHub repository https://github.com/nihuanhe/claw2bio, fetch ONLY the folder
   bioinformatics/bulk_RNA_seq/bulk-RNA-seq (use sparse checkout — do NOT clone the whole
   repository), and place it at D:\claw2bio\bulk-RNA-seq.
3. If downloading from GitHub fails or is too slow, download the zip from this mirror link instead:
   https://my-website-1358159656.cos.ap-guangzhou.myqcloud.com/bulk-RNA-seq/zip/bulk-RNA-seq.zip
   and extract it to D:\claw2bio\bulk-RNA-seq.
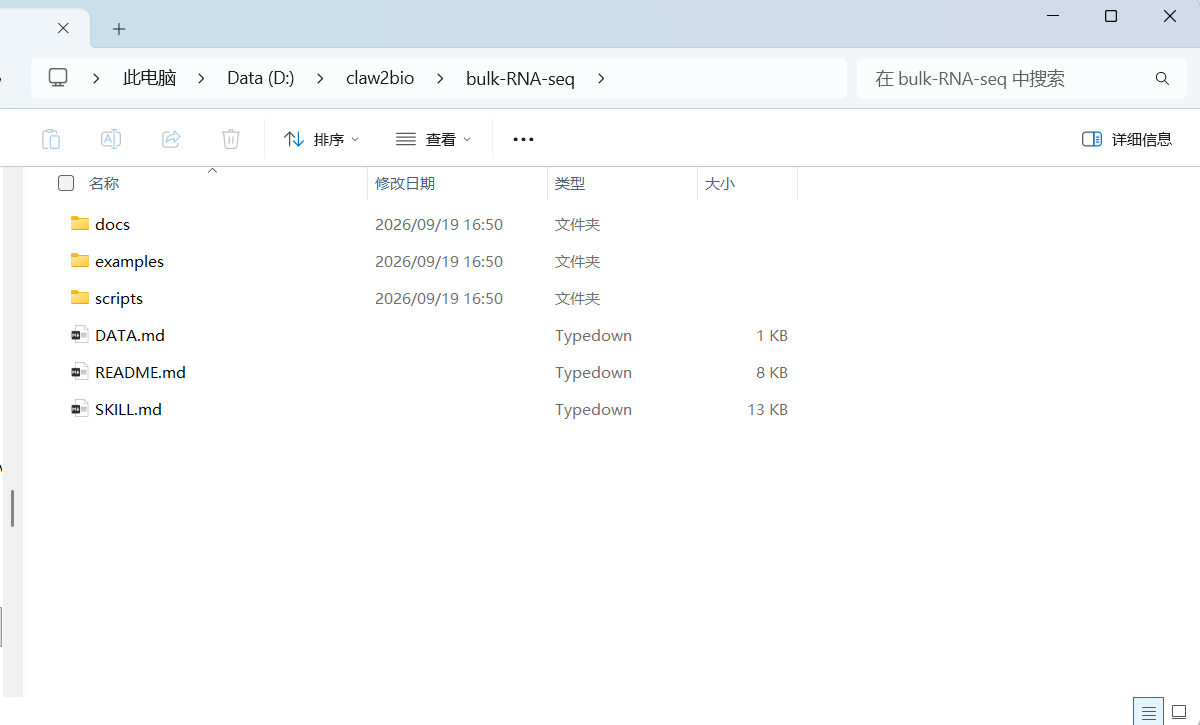
4. Read the SKILL.md inside, then confirm to me that the skill is ready and list the contents
   of the folder.
(If my PC has no D: drive, install to C:\claw2bio instead and tell me the actual path.)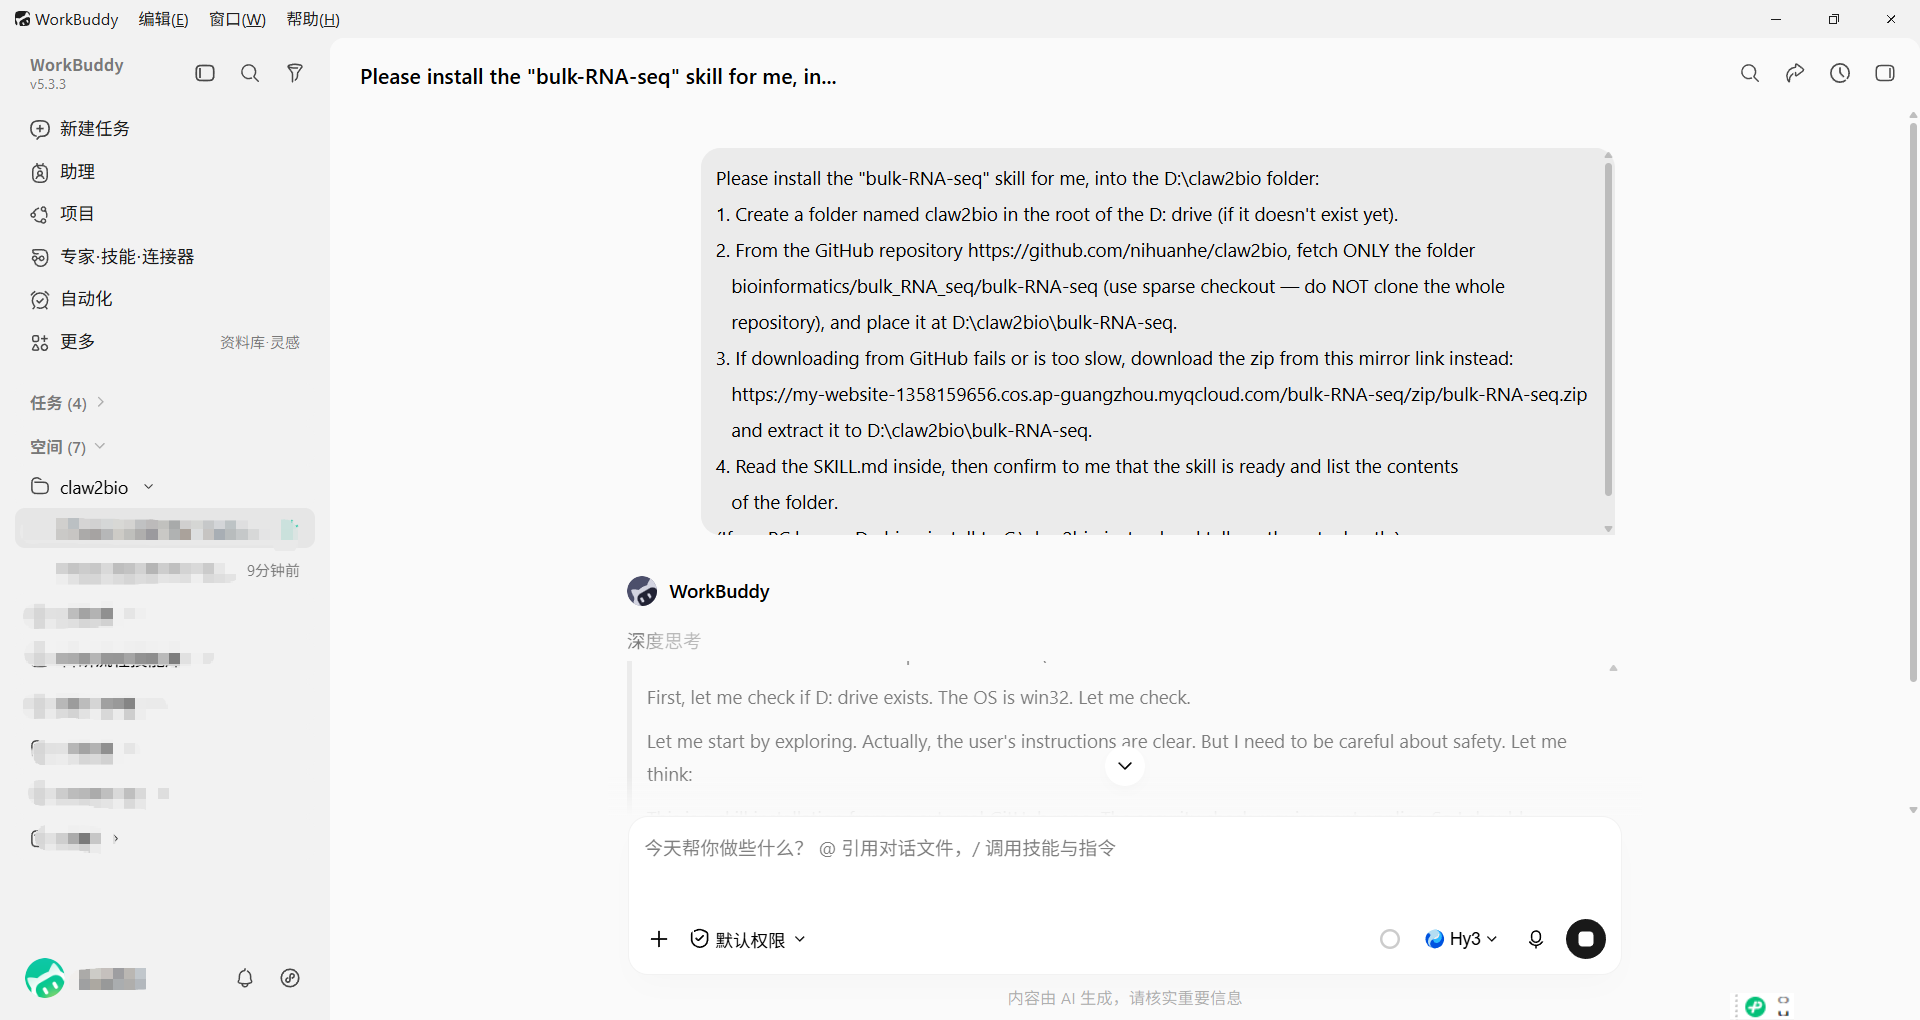
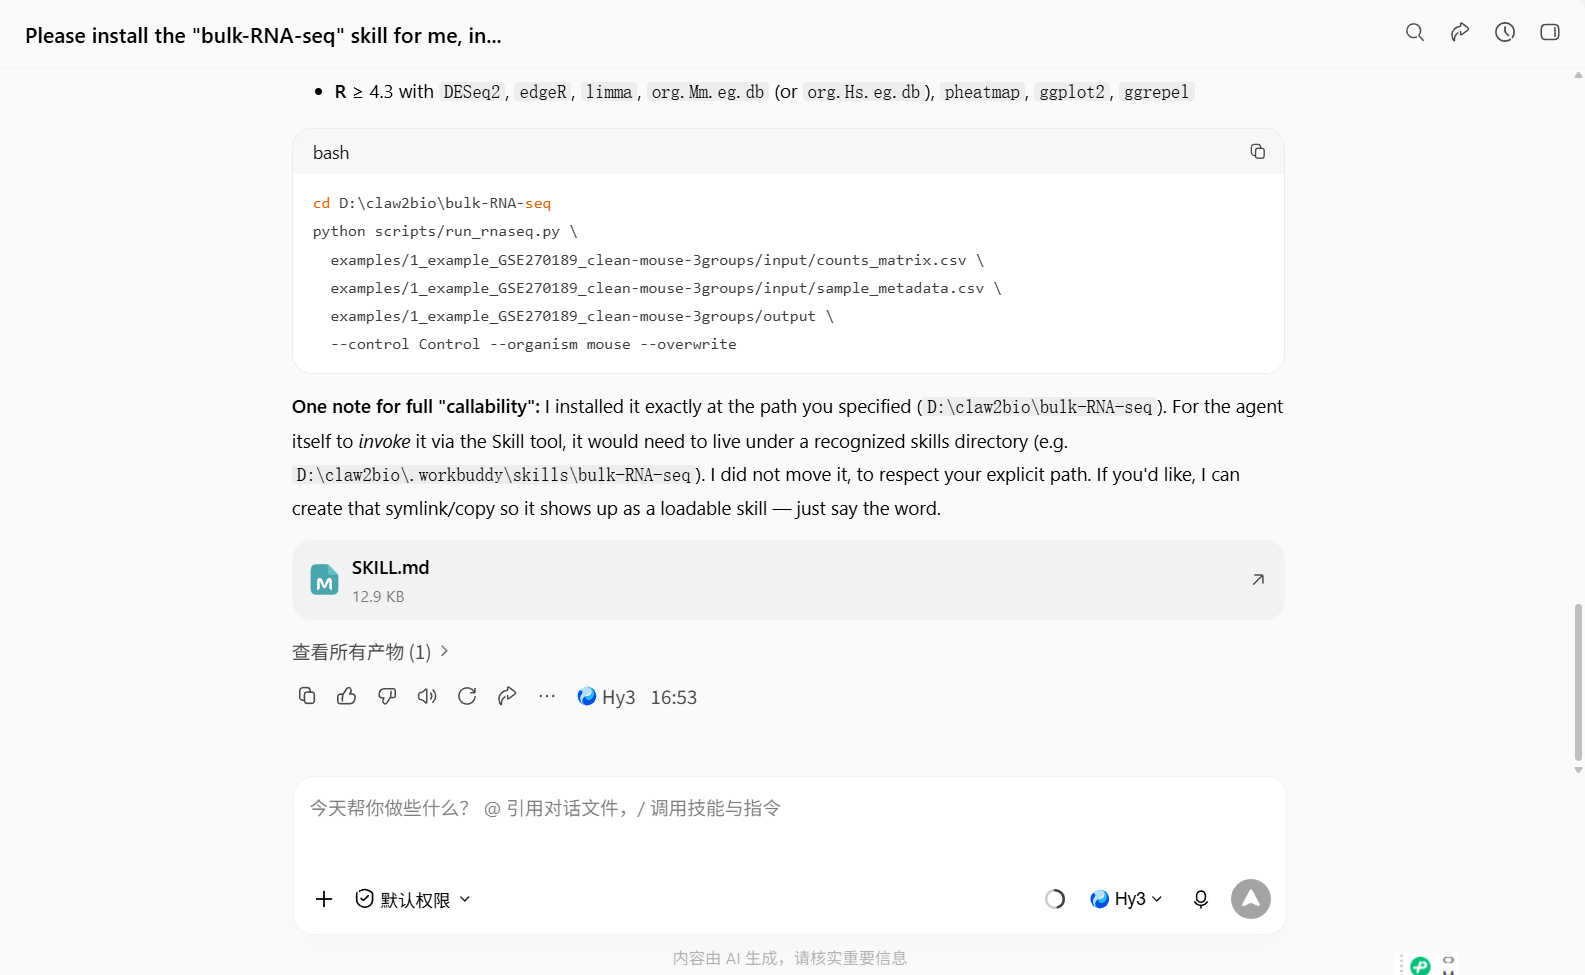
Step 1 complete:
Check the file manager:
Step 2 | Set up the runtime environment
Type in the prompt:
Please set up the runtime environment for me:
1. First, SEARCH THIS PC for an existing R installation. If R is already installed,
   report its version to me; if the version is BELOW 4.5, advise me to install a newer
   version and wait for my confirmation. Only if R is NOT installed at all, install
   R version 4.5 or above (Windows), downloaded from the official R website (CRAN),
   accepting all default options.
2. Install all R packages this skill needs: try CRAN / Bioconductor online first;
   if any package fails or is too slow (especially large annotation packages such as
   org.Hs.eg.db and org.Mm.eg.db), stop and tell me about it — I will provide a
   mirror download address.
3. When everything is installed, run the dependency-check script scripts/00_check_deps.R
   inside the skill folder and show me the result.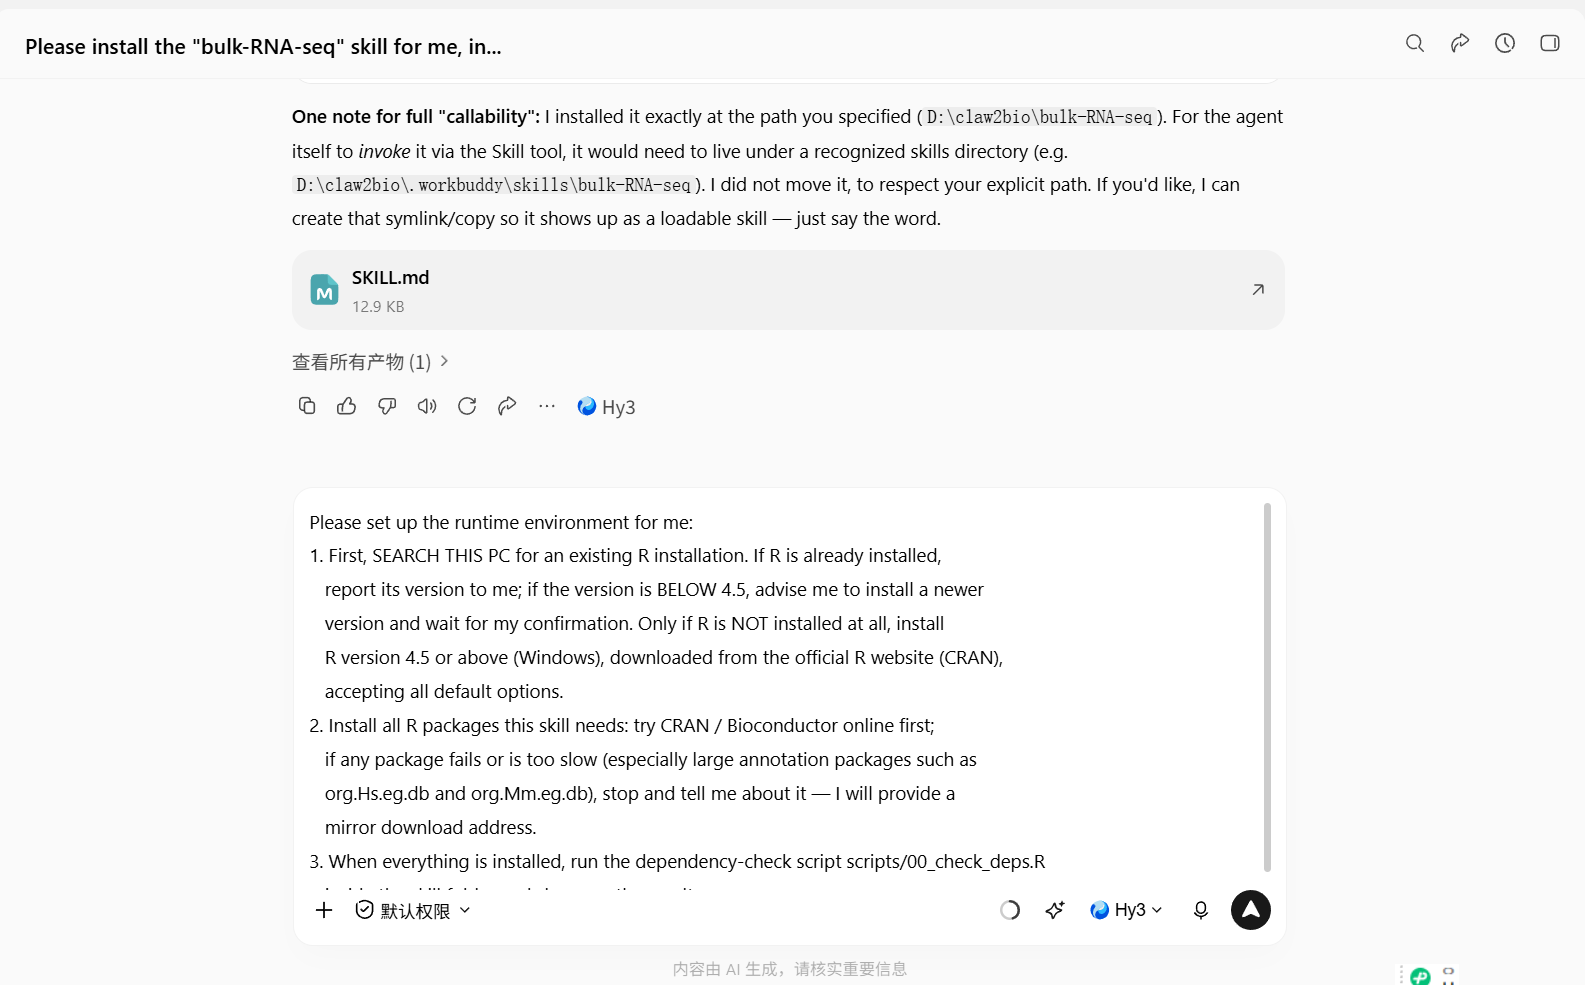
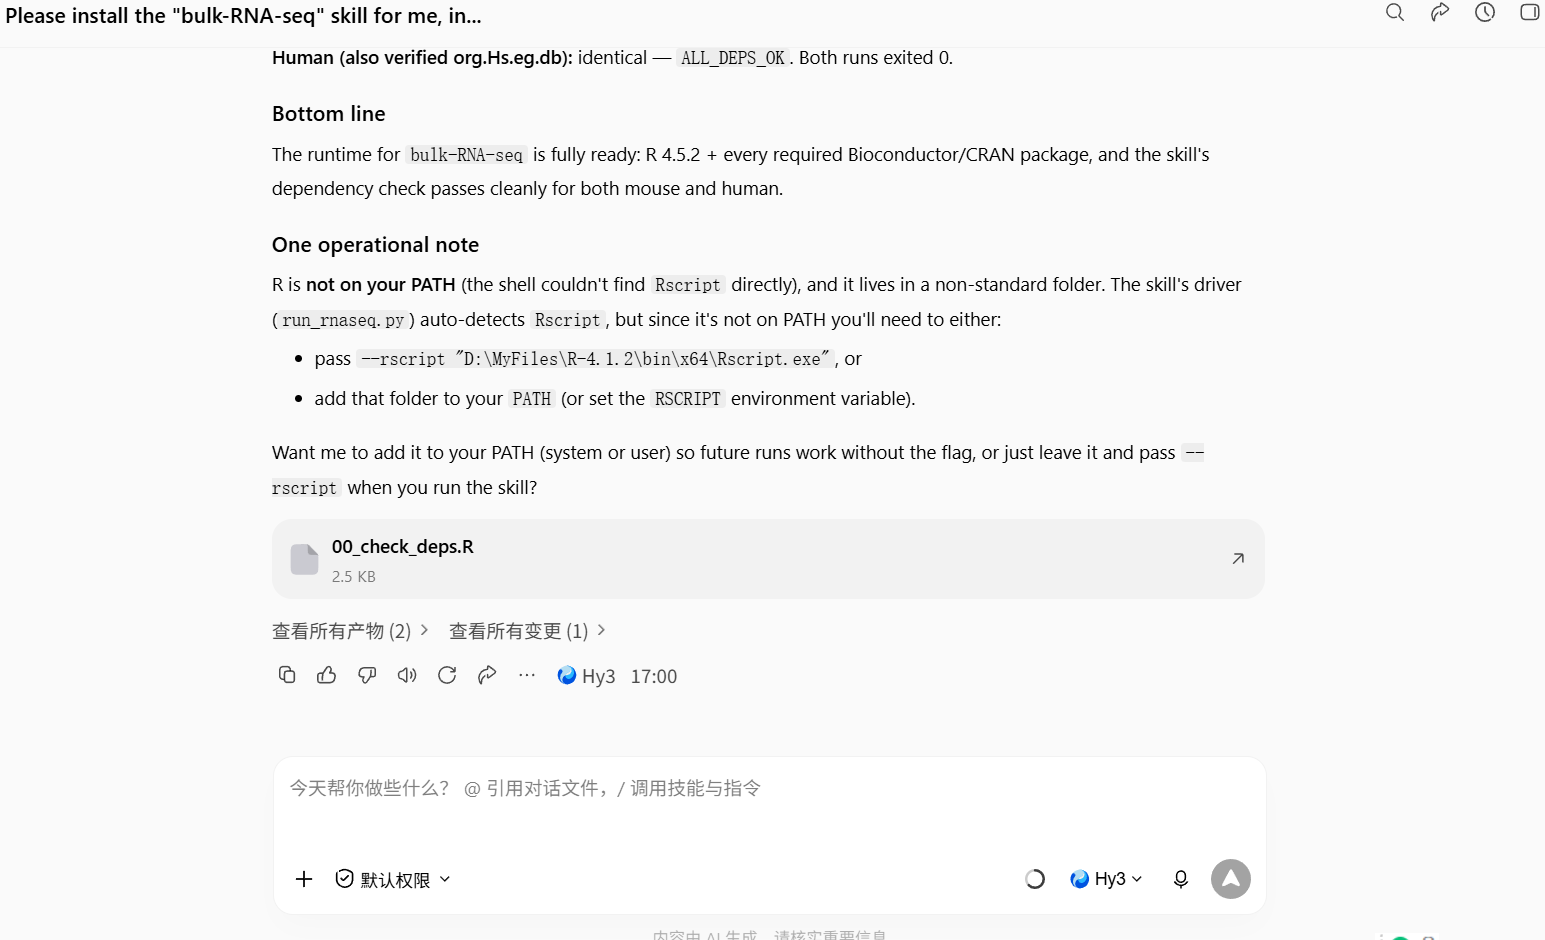
When step 2 finishes, the AI agent will tell you the R version installed on your PC and the script locations.
Offline installation (when the network is slow or installs fail)
If online installation from CRAN / Bioconductor is too slow or keeps failing, use the offline dependency packages we host on COS instead — a complete closure of 139 R packages (R 4.5 Windows binaries, battle-tested with this skill's scripts):
1. Download the r-deps offline repository (~425 MB):
https://my-website-1358159656.cos.ap-guangzhou.myqcloud.com/bulk-RNA-seq/deps/r-win/r-deps.zipUnzip it, then run in R (replace <path-to> with the actual extraction folder):
install.packages(c("DESeq2", "edgeR", "limma", "clusterProfiler", "DOSE",
                   "enrichplot", "org.Mm.eg.db", "org.Hs.eg.db",
                   "pheatmap", "ggplot2", "ggrepel"),
                 repos = "file:///<path-to>/r-deps", type = "win.binary")
R resolves the dependency order automatically from the bundled PACKAGES index.
2. Or download individual OrgDb annotation packages as needed:
| File | Package | Type |
|---|---|---|
| org.Mm.eg.db_3.22.0_R4.5_win-binary.zip | org.Mm.eg.db (mouse) | Windows binary, R 4.5 |
| org.Hs.eg.db_3.22.0_R4.5_win-binary.zip | org.Hs.eg.db (human) | Windows binary, R 4.5 |
| org.Hs.eg.db_3.22.0.tar.gz | org.Hs.eg.db (human) | Source, cross-platform |
Install a single package (run R in the download folder):
install.packages("org.Mm.eg.db_3.22.0_R4.5_win-binary.zip",
                 repos = NULL, type = "win.binary")
⚠️ All offline packages above are built for R 4.5.x. If your R version is not 4.5.x, install online via
BiocManager::install(...)instead.
Step 3 | Run the bundled example data
Type in the prompt:
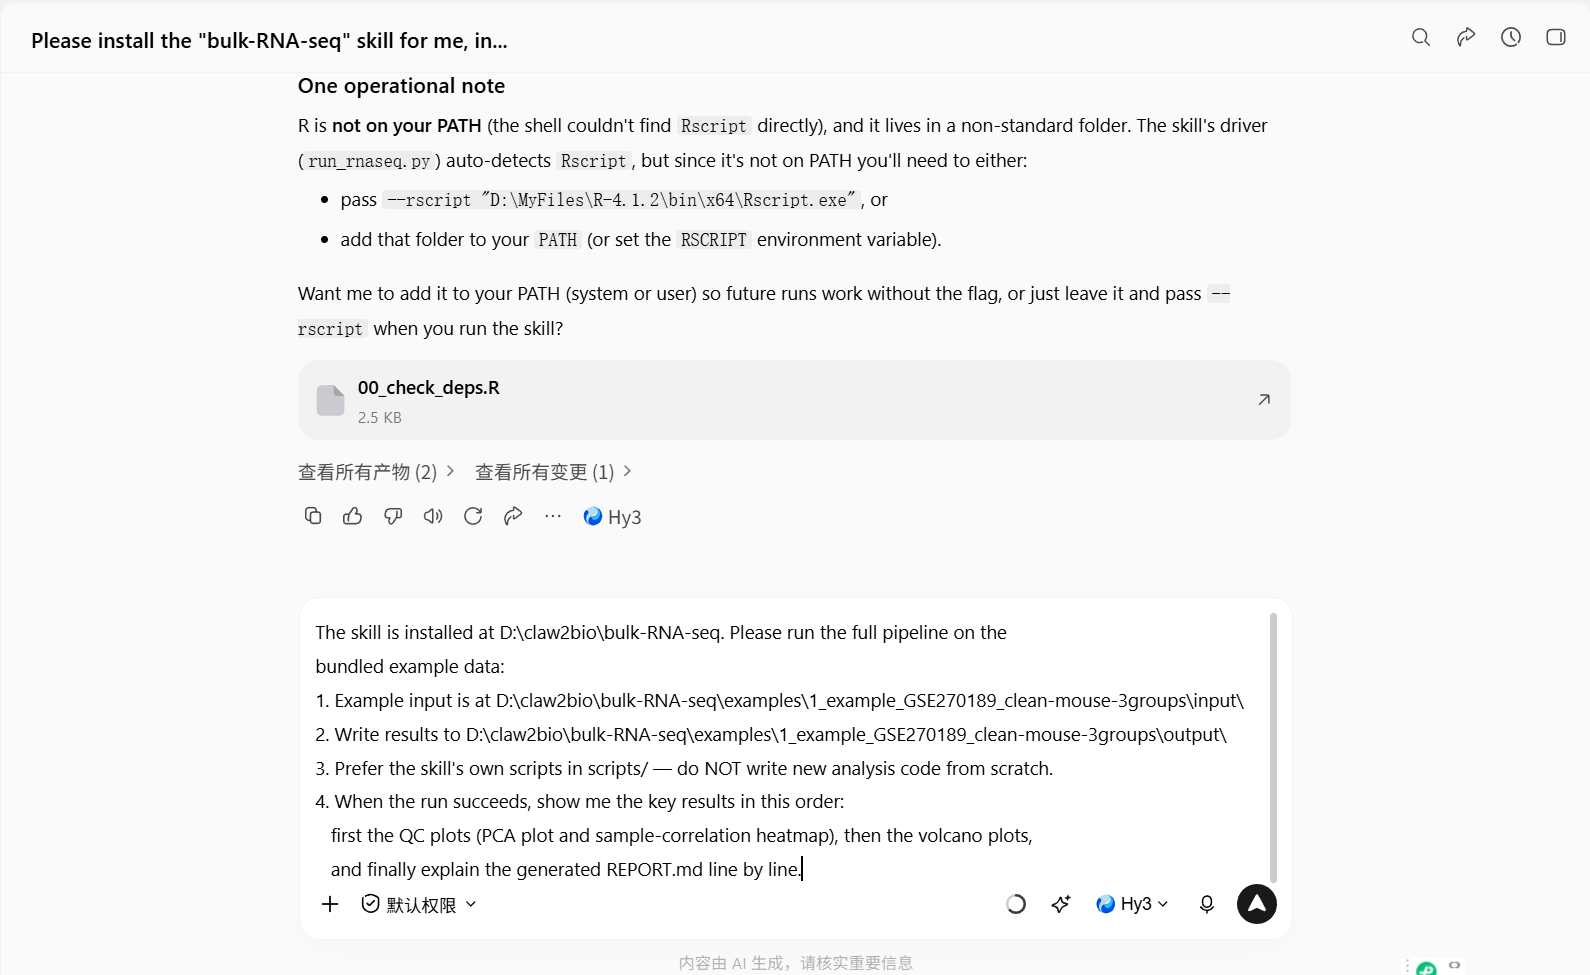
The skill is installed at D:\claw2bio\bulk-RNA-seq. Please run the full pipeline on the
bundled example data:
1. Example input is at D:\claw2bio\bulk-RNA-seq\examples\1_example_GSE270189_clean-mouse-3groups\input\
2. Write results to D:\claw2bio\bulk-RNA-seq\examples\1_example_GSE270189_clean-mouse-3groups\output\
3. Prefer the skill's own scripts in scripts/ — do NOT write new analysis code from scratch.
4. When the run succeeds, show me the key results in this order:
   first the QC plots (PCA plot and sample-correlation heatmap), then the volcano plots,
   and finally explain the generated REPORT.md line by line.
Step 3, started:
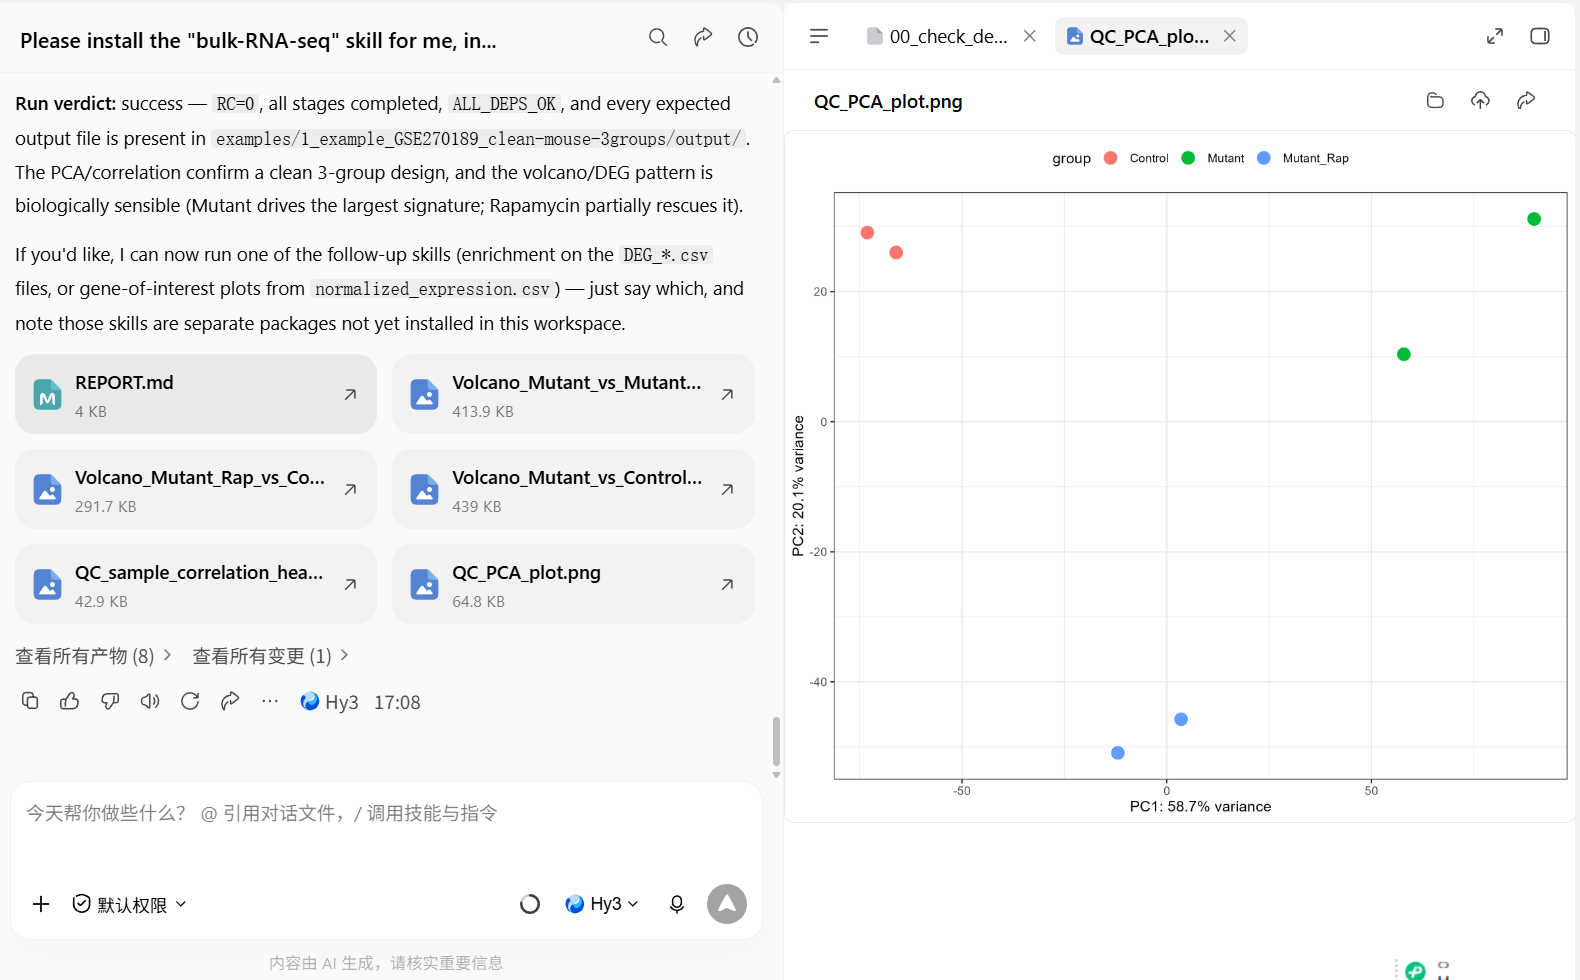
Step 3, finished. Take a look at the QC_PCA_plot:
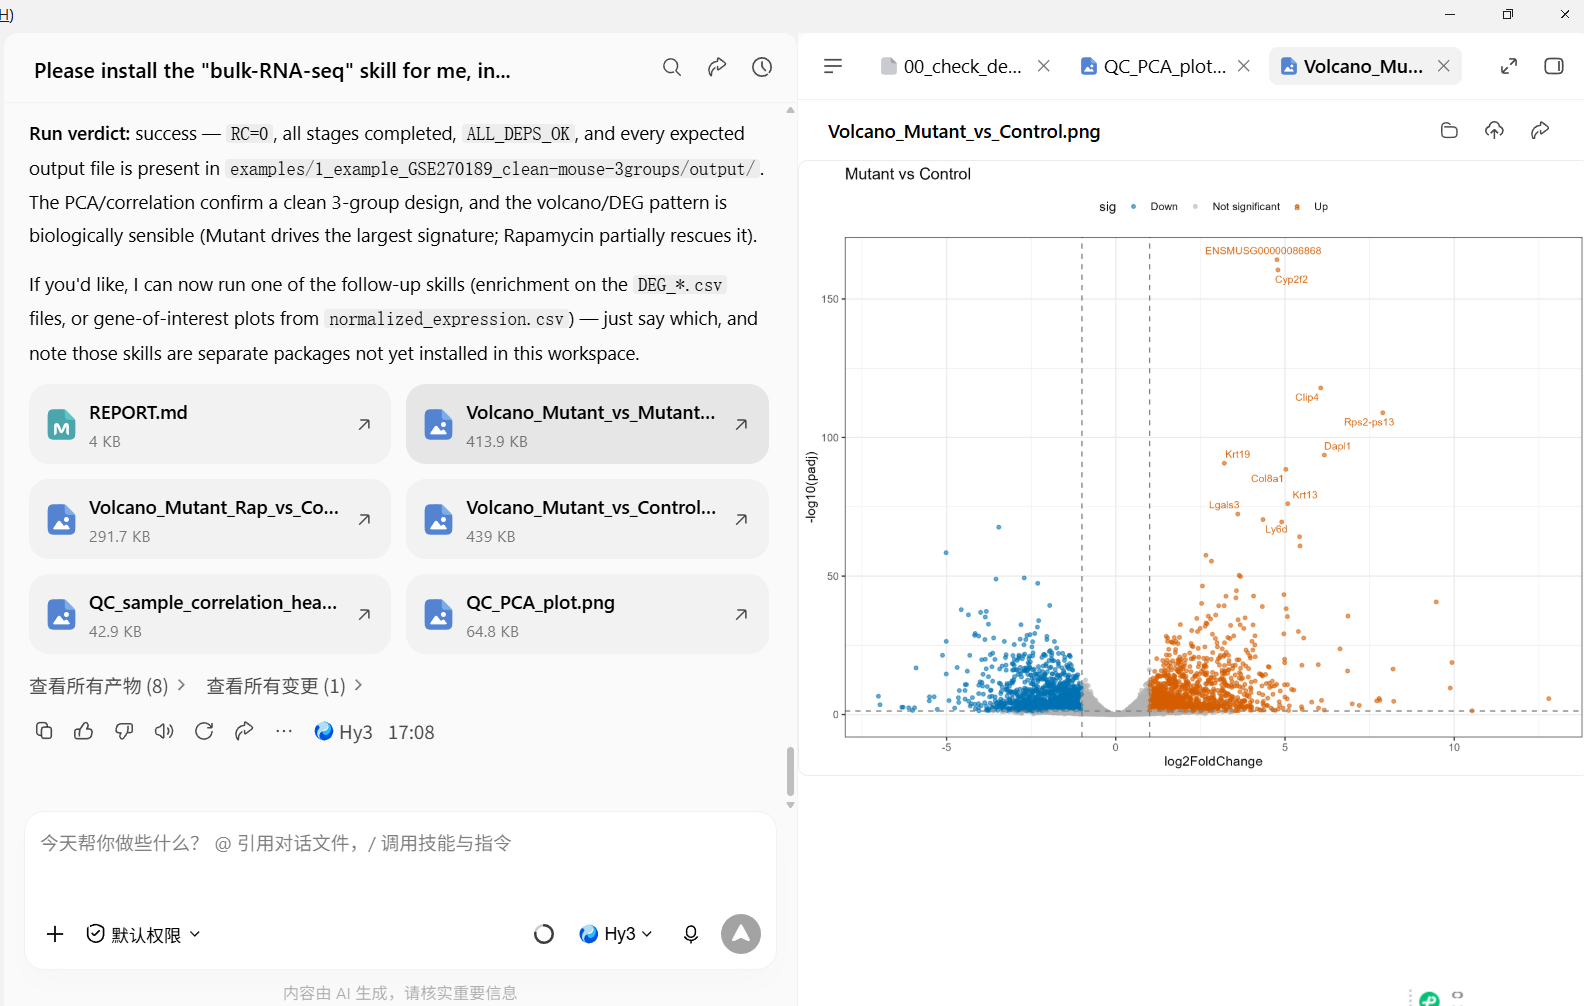
Step 3, finished. Take a look at the volcano plot:
Step 4a | No data yet? Grab a public dataset from GEO (copy-paste)
Most people don't have their own matrix on day one. GEO (Gene Expression Omnibus) hosts hundreds of thousands of public datasets — you only need an accession number such as GSE223159.
Paste this prompt (the agent downloads the data for you — no browser hunting, no manual unzipping):
I don't have my own data yet. Please fetch the public dataset GSE223159 from GEO for me:

1. Download it into examples/input/ (use GEOquery::getGEOSuppFiles / getGEO, or the NCBI
   download links — whichever works; if the download is slow or blocked, tell me before retrying).
2. Then tell me, in plain language:
   - is this a raw count matrix, or already normalised values (FPKM/TPM/logCPM)?
   - how many genes and how many samples does it have?
   - does it come with sample grouping information? If yes, what are the groups?
   - is it directly usable for differential expression analysis? If not, what is missing
     or what would need fixing first?
3. Do not run the analysis yet — just report back what the data is.
Read the answer, then continue with Step 4 below, pointing at the file the agent saved. (Any other accession works too: just replace GSE223159 with the GSE number you are interested in.)
Step 4 | Switch to your own data
At this point, we can run bioinformatics analysis on our own bulk RNA-seq matrix data.
Here, we assume the GSE223159 dataset is your own matrix:
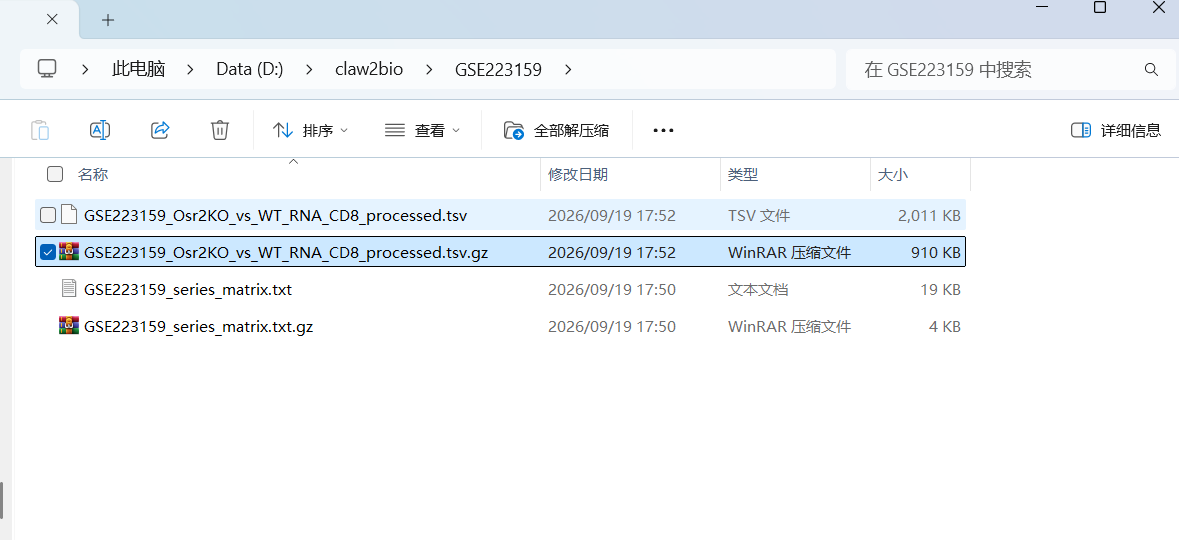
Paste the prompt:
My data is at: <paste the path to your data file here>.
Please first check whether my data has any format problems; if so, fix them and tell me
what you did. Once the data checks out, run the full pipeline and show me the result
figures and the DEG tables.
Prefer the skill's own scripts in scripts/; if anything needs adapting, make the smallest
possible change — do NOT write large amounts of new code.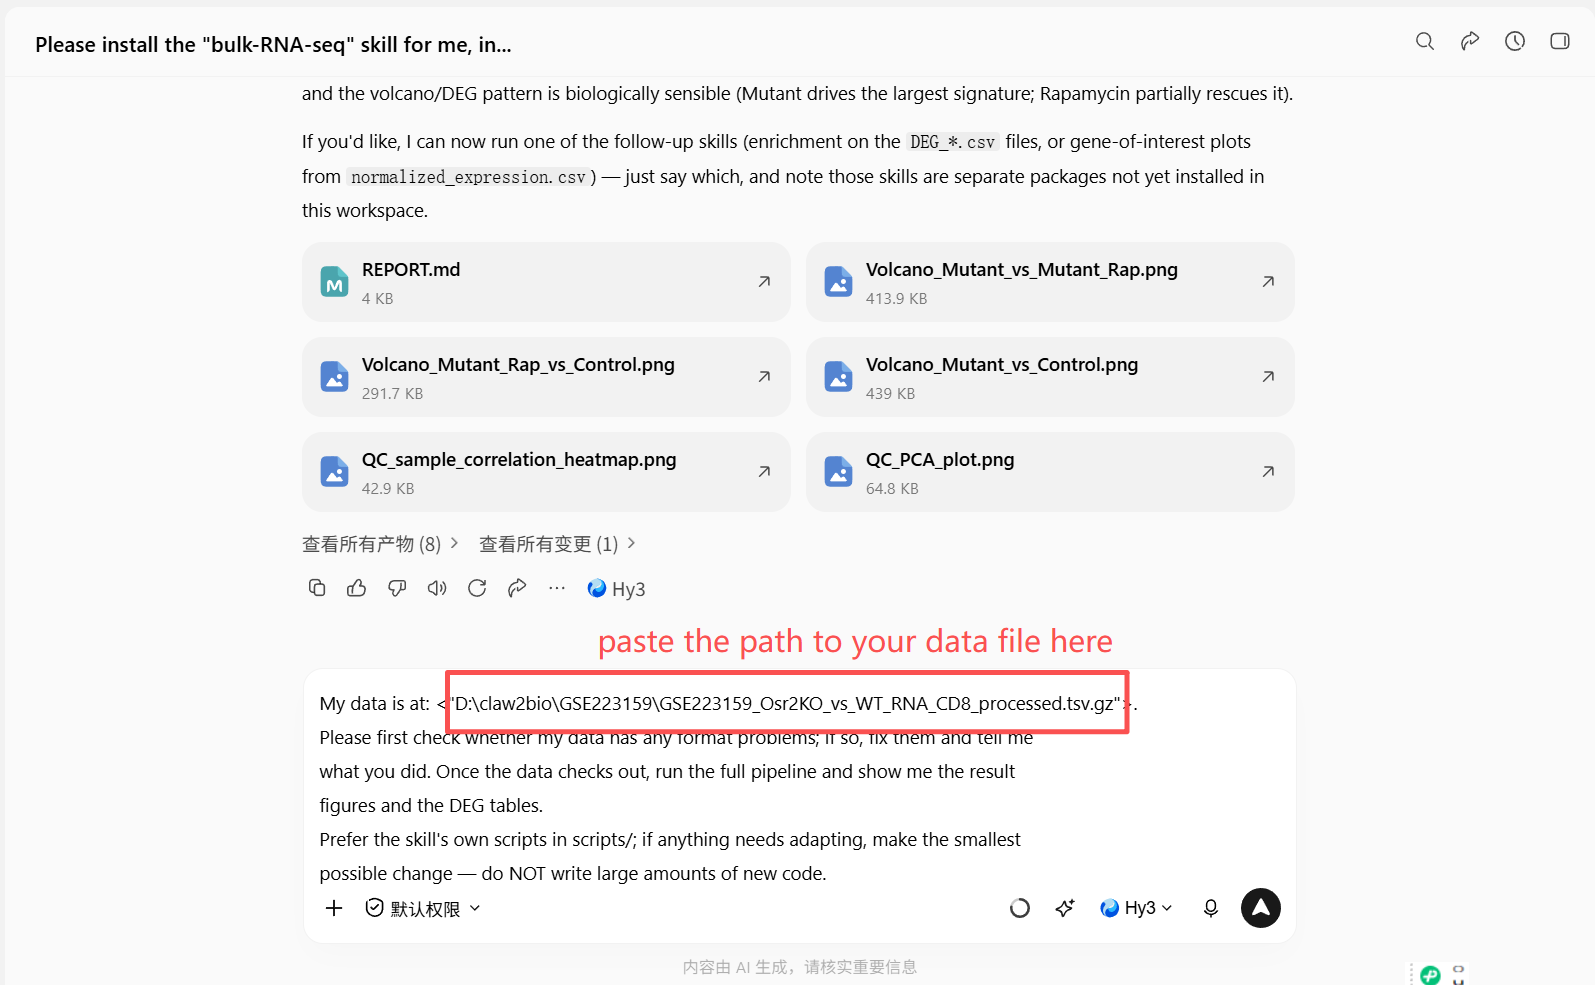
Wait for the AI agent to finish:
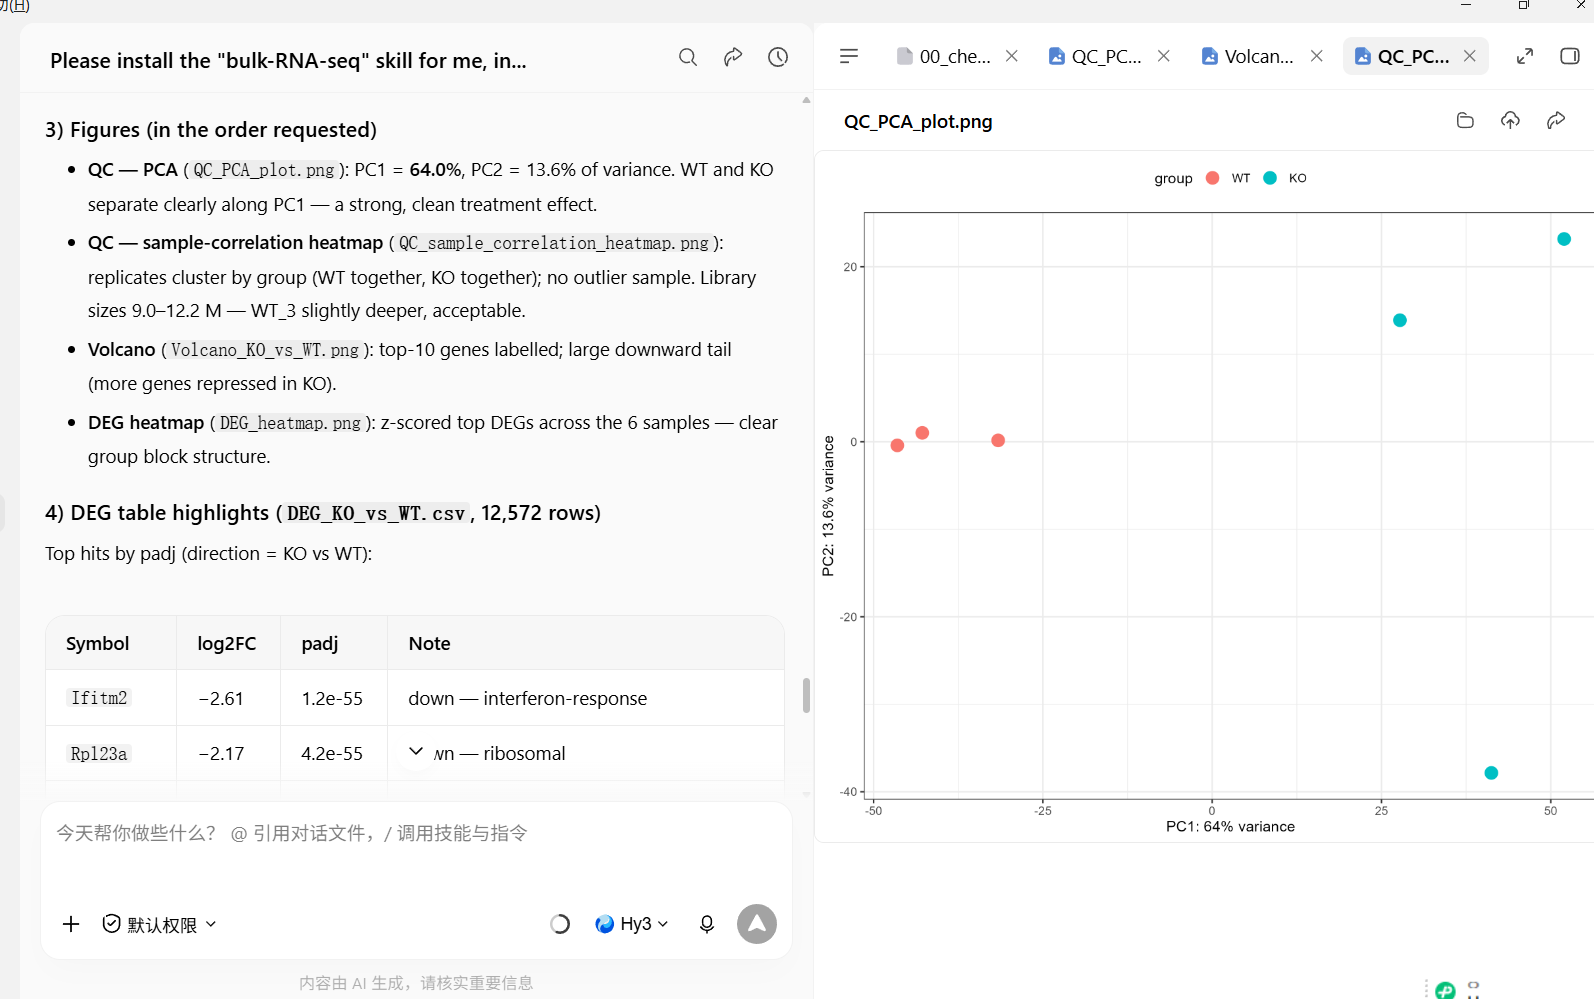
Step 5 | Read the REPORT.md: summary and interpretation of your results
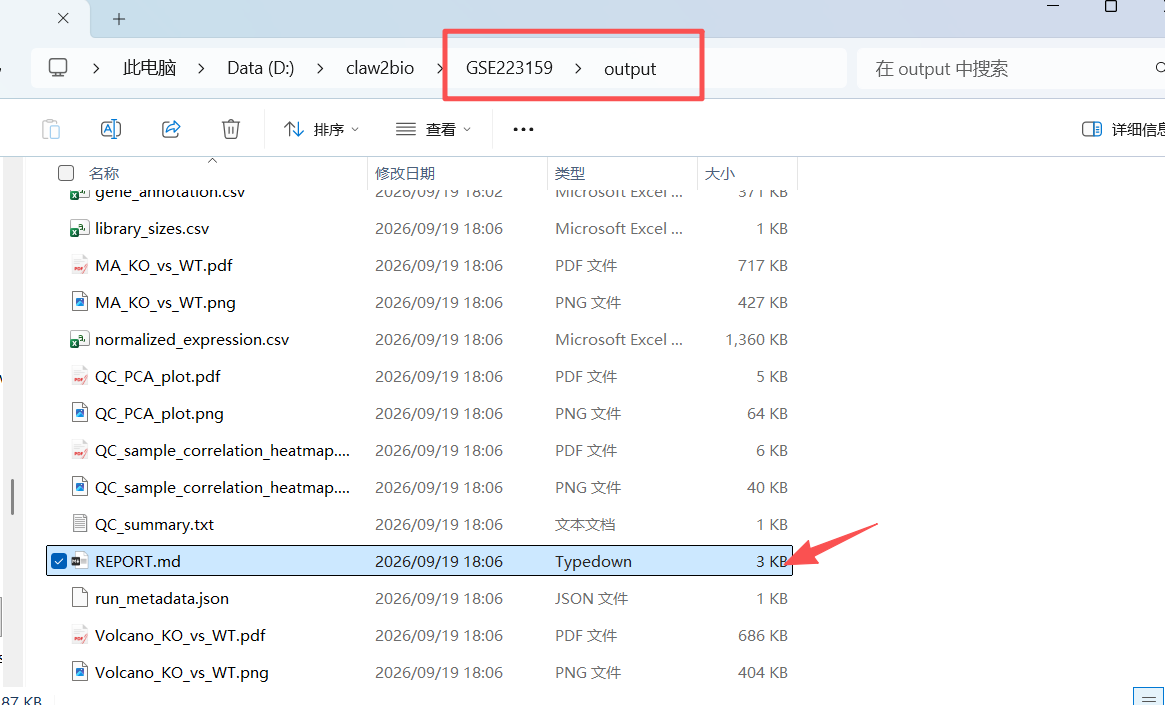
Let the AI interpret the results for you:
Please explain the REPORT.md in my results folder line by line:
1. What each output file is and what it contains;
2. How many differentially expressed genes were found in total, and how many are
   up- vs down-regulated;
3. Any warnings or things I should pay attention to (e.g., sample quality, group balance).
After explaining, tell me which results can be used directly in a paper or presentation.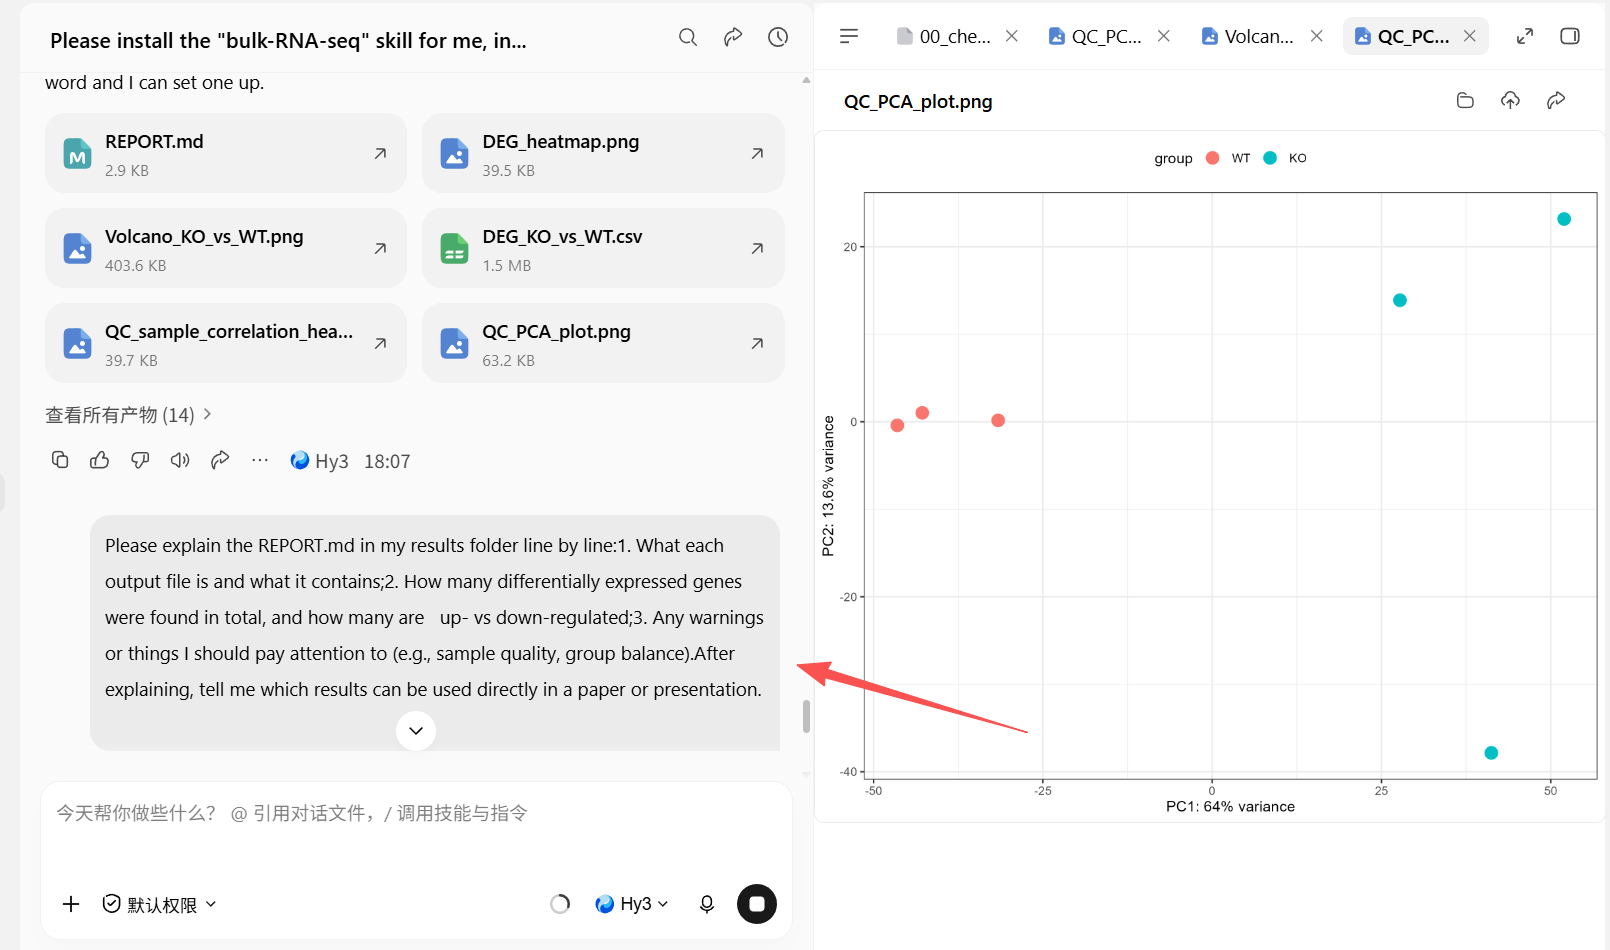
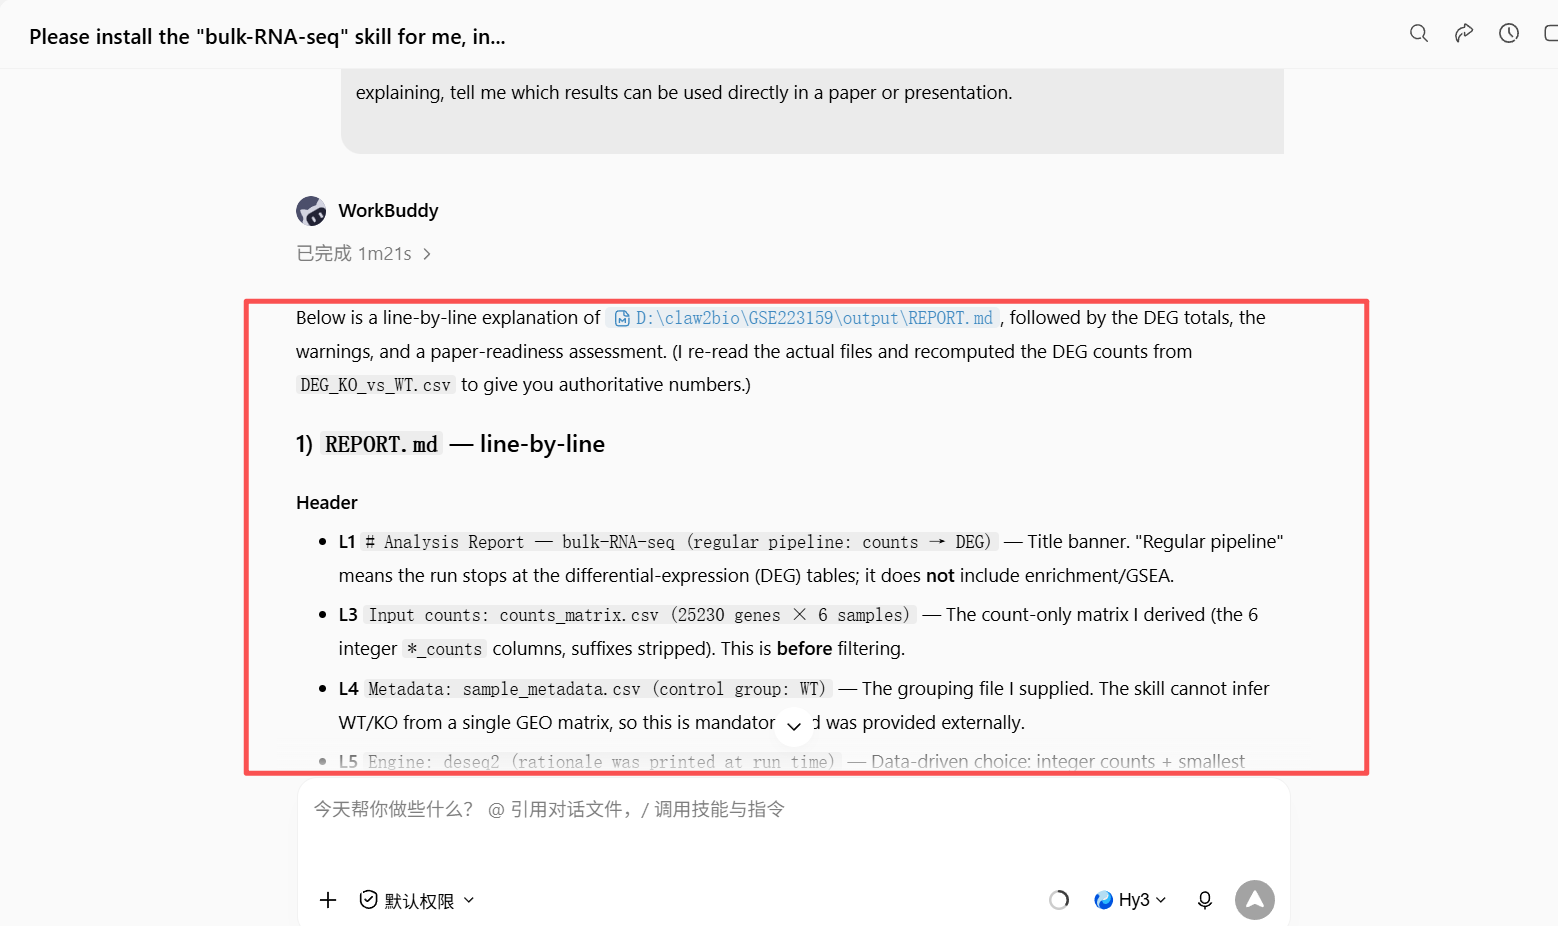
After reading the AI's explanation, if anything is unclear, just ask it directly:
Step 6 | More than 2 groups? You pick the comparisons for DEG (differential expression analysis)
Type in the prompt:
My samples have multiple groups. Please read my sample-metadata table first, list all
group names with the number of samples in each, and show me the list.
Do NOT start the analysis yet — wait until I tell you which comparisons to run.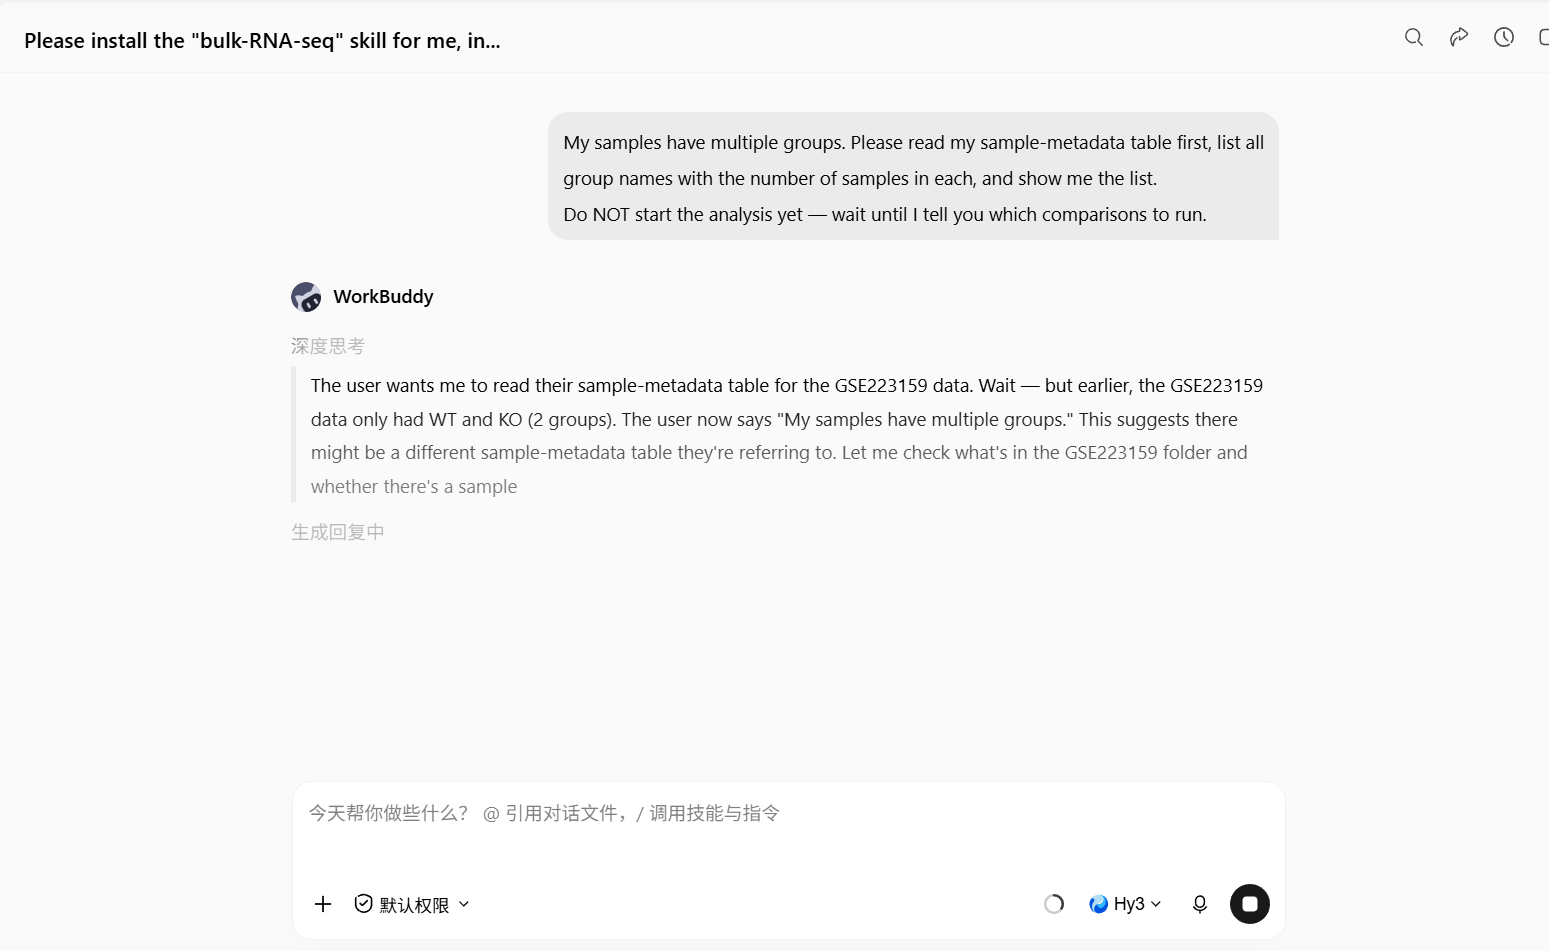
The AI agent will display all groups for you, or you can check the metadata file in the folder:
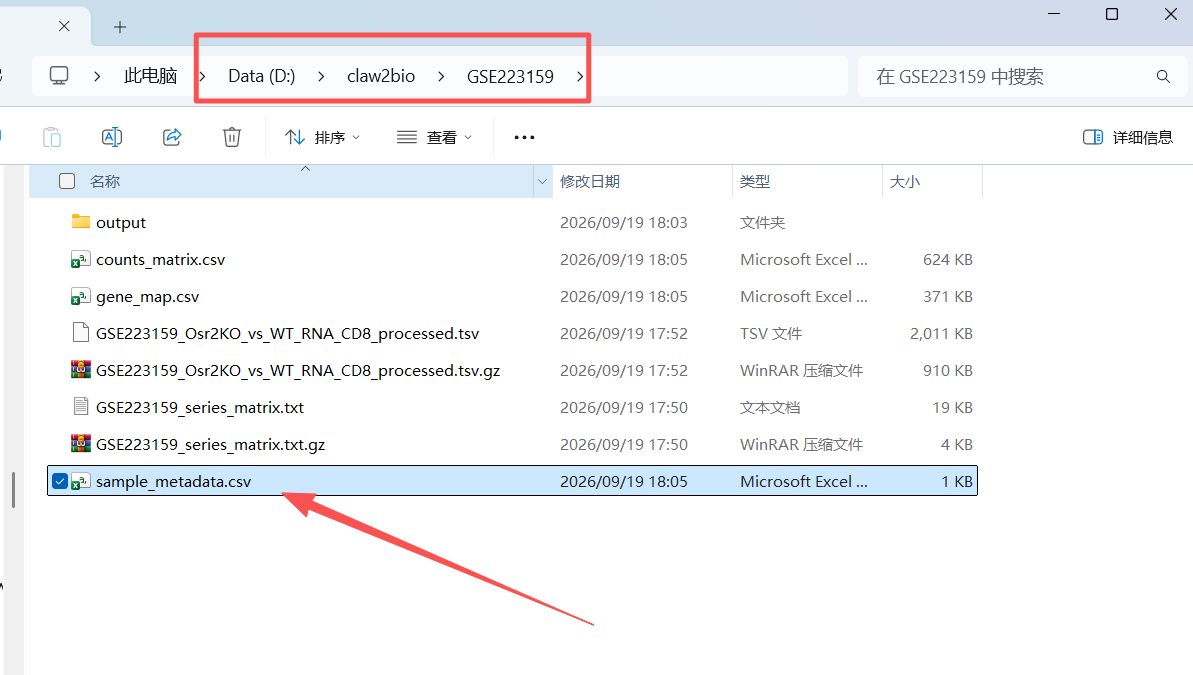
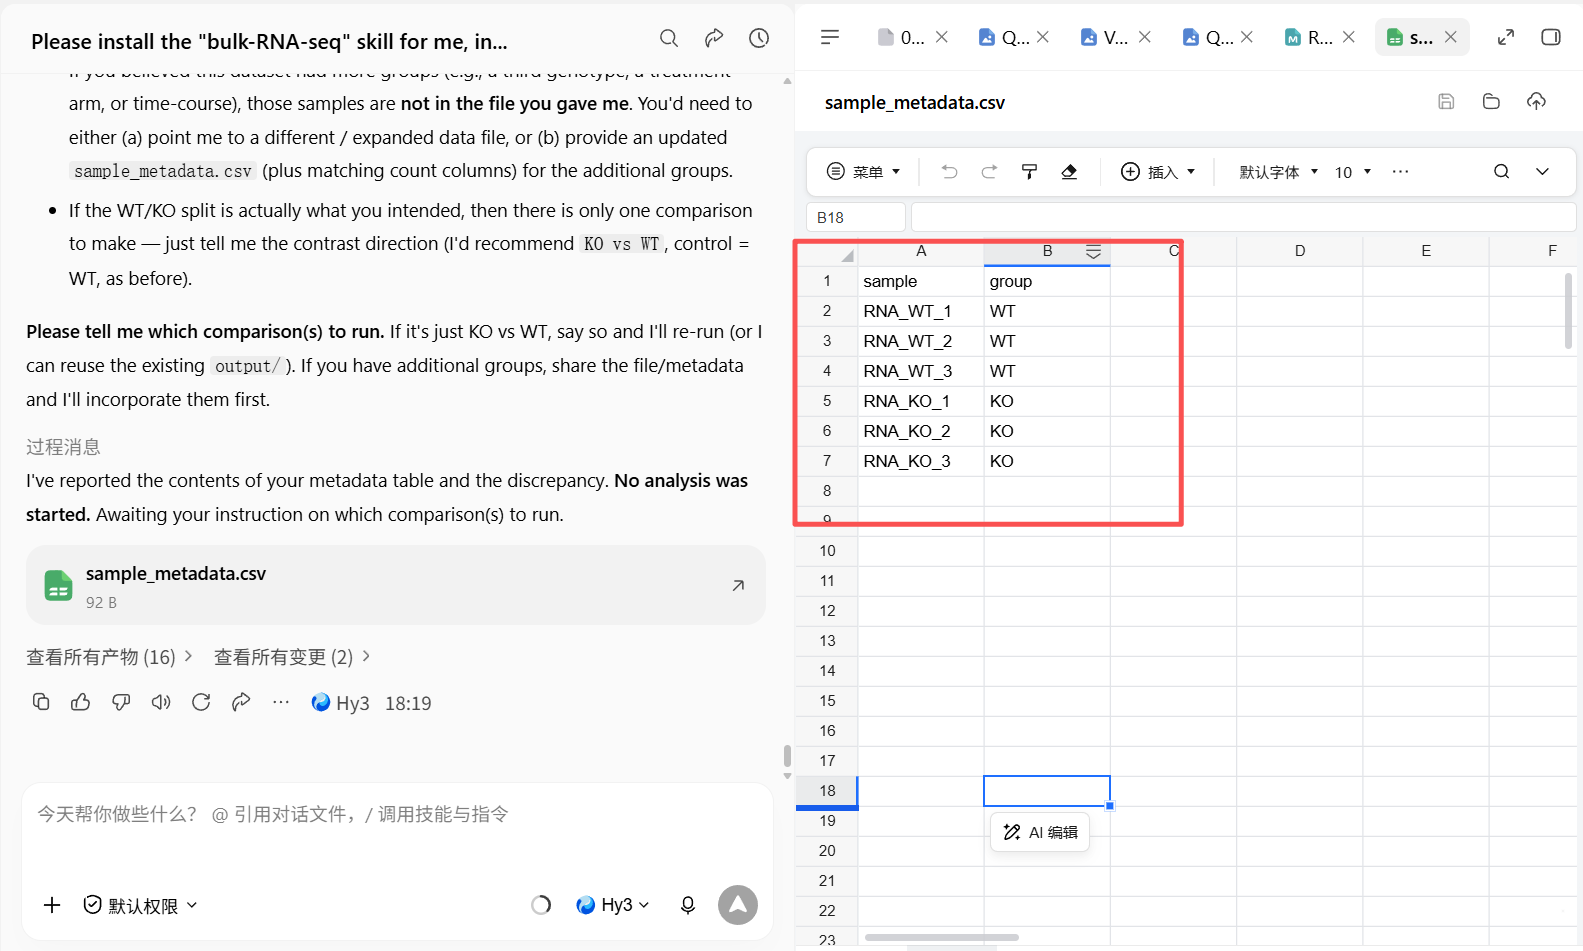
Pick the group comparisons for DEG analysis (RNA_WT vs RNA_KO, three replicates each), then type in the prompt:
Please compute ONLY these comparisons: <write them here, e.g., Model vs Control,
Treatment vs Model>, write the results to D:\claw2bio\bulk-RNA-seq\output, and show me
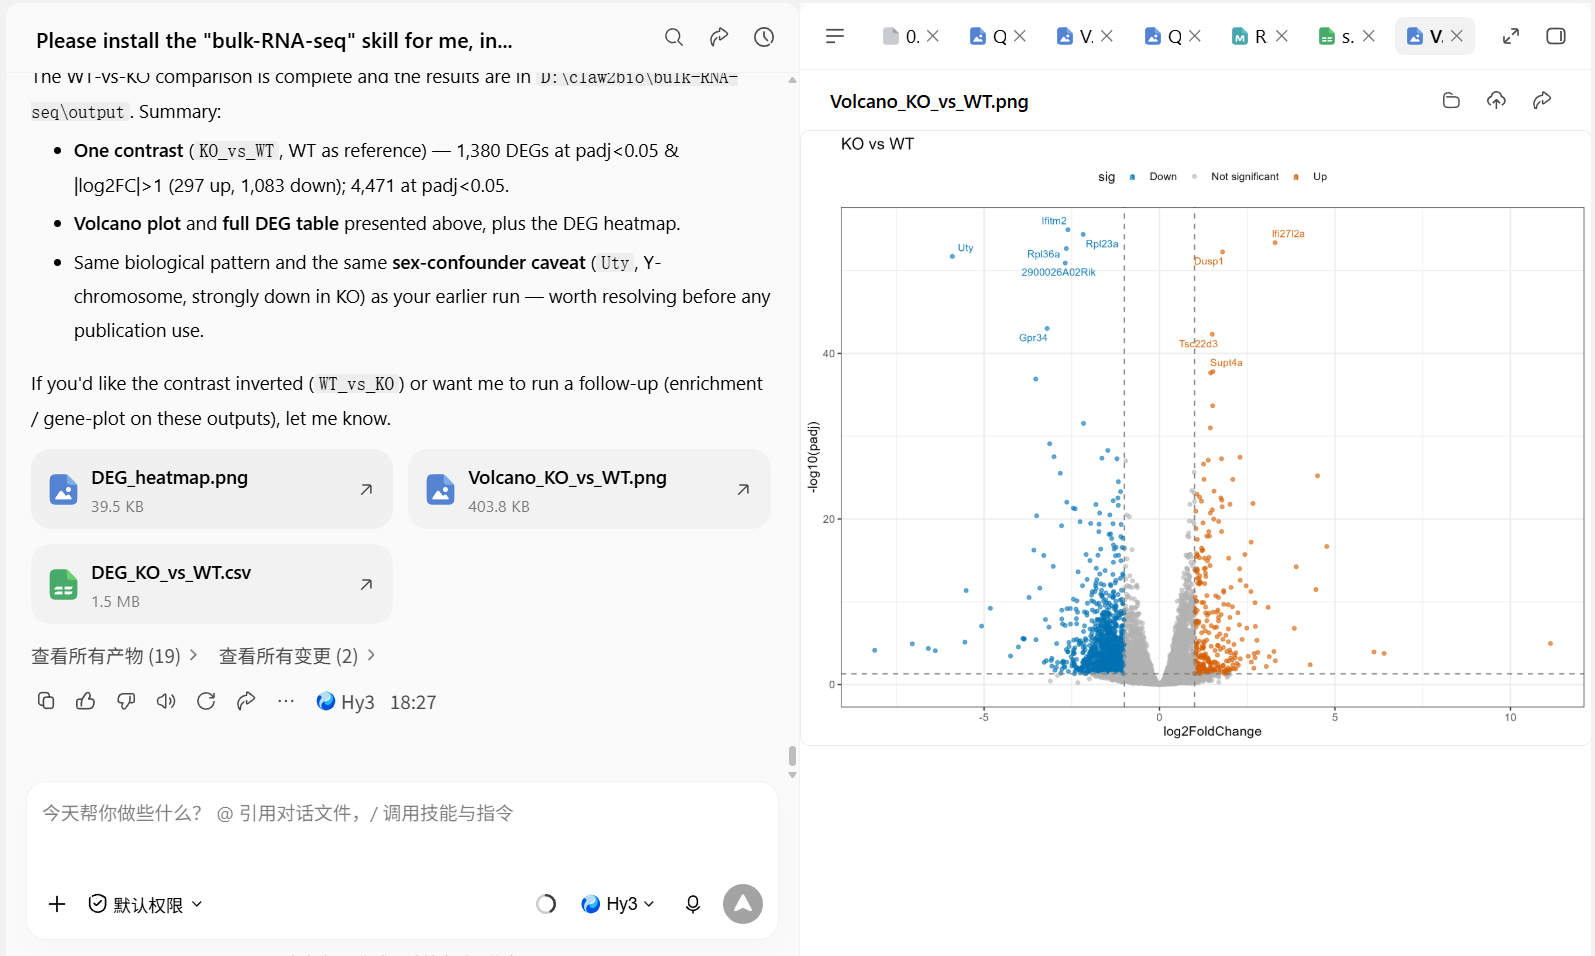
the volcano plots and DEG tables for each comparison.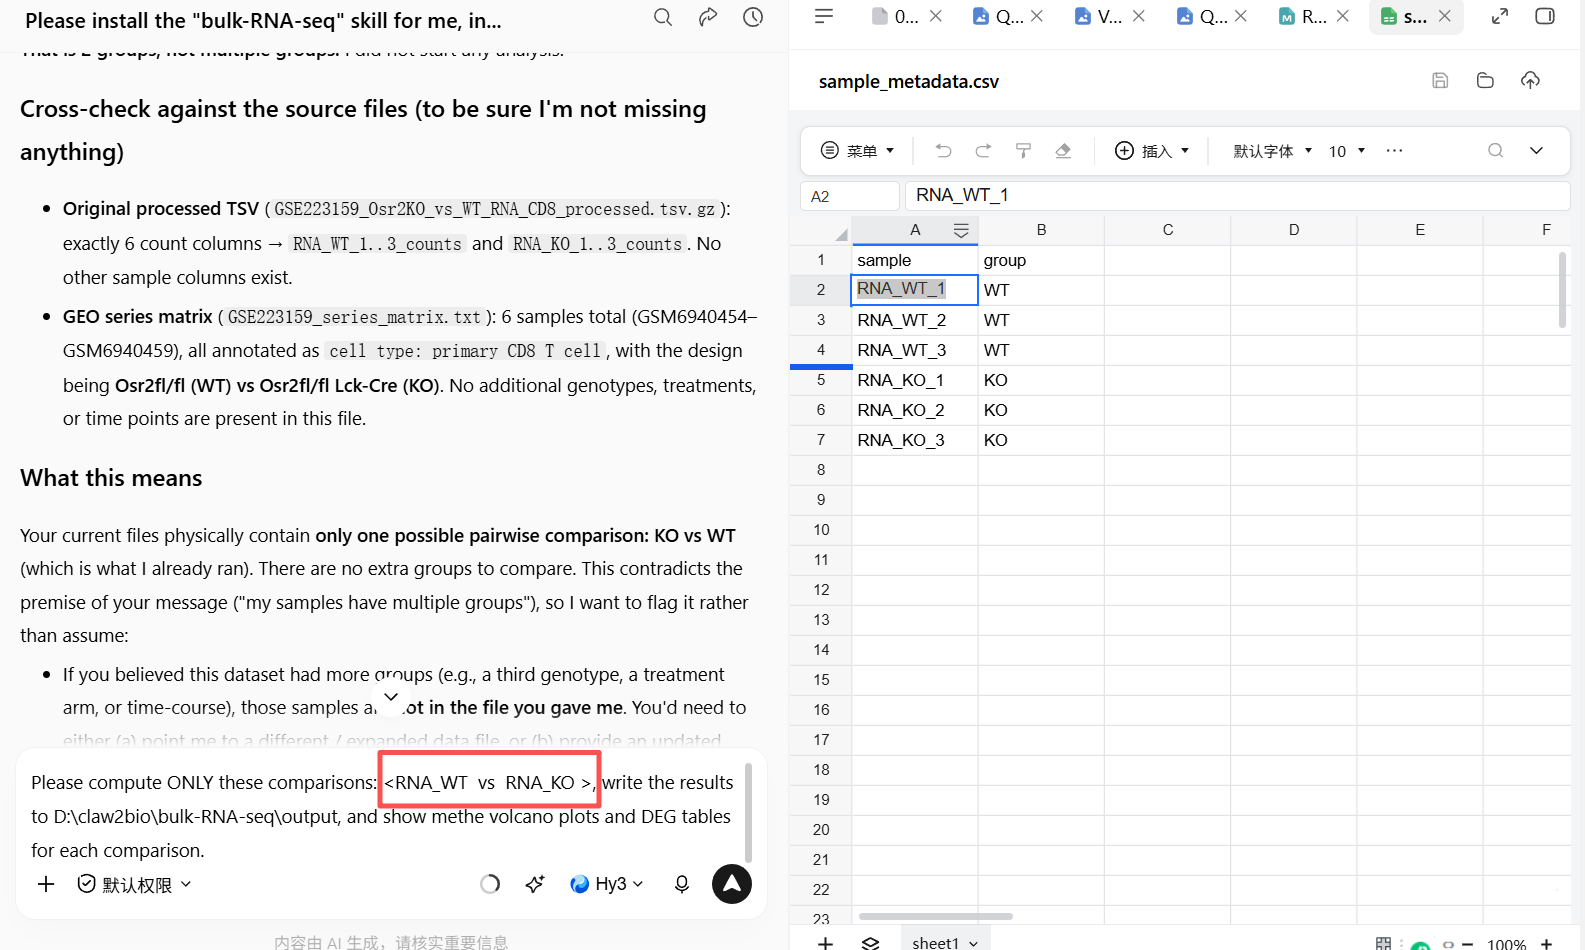
DEG analysis results:
More analyses
For more analyses such as KEGG, GO and GSEA, see the related skills at www.claw2bio.site — just keep the output data from your own dataset and you're ready to go.
This skill stops at differential expression analysis (DEG). The two downstream skills below consume this skill's output directly, and are installed exactly the same way as this one (one-click prompt or zip download from the website):
Enrichment analysis (GO / KEGG / Reactome) — RNA-seq-enrichment
In one sentence: DEG tables in, GO / KEGG / Reactome enrichment tables and dot plots out.
Point it at the bulk-RNA-seq output directory (or any folder containing DEG_*.csv files). It automatically splits each contrast into up- and down-regulated gene sets and runs clusterProfiler enrichment for GO (BP/MF/CC), KEGG, and Reactome — producing one table and one dot plot per direction per pathway database. GO and Reactome run fully offline; KEGG prefers online queries and automatically falls back to a local cache, so plots are generated even without internet. Supports human and mouse.
Details & download: /skills/RNA-seq-enrichment
Gene-of-interest expression bar plots — RNA-seq-gene-plot
In one sentence: pull a single gene out of the normalized matrix and plot it.
Give it the normalized expression matrix plus the sample-metadata table, and it answers two kinds of questions:
- How much is a gene expressed across groups — bar plot + SD error bars + jittered points, t-test for 2 groups, ANOVA + Tukey for ≥3 groups, with the statistical method noted in the caption;
- Which of two genes is higher within the same group (e.g., TP53 vs GAPDH) — side-by-side bars + SD + points, with a paired t-test within each group.
Gene lookup supports Ensembl IDs or Symbols (case-insensitive), depends only on ggplot2, and is one of the lightest skills — perfect for plotting key genes in a paper.
Details & download: /skills/RNA-seq-gene-plot