
Zero-Basics — qPCR Mitochondrial DNA Copy-Number Analysis with an AI Agent | Copy & Paste All the Way
This tutorial uses workbuddy as the AI agent and Hy3 as the AI API. For installing and configuring the AI agent itself, see the AI Agent setup tutorial.
Before you start (must read):
- If this is your first time doing data analysis with an AI agent, we strongly recommend following the bulk-RNA-seq differential analysis tutorial first, to learn the full "install skill → set up environment → run example → switch to your own data" workflow, then come back to this skill.
- This skill is standalone — it does not depend on the output of any other skill. Give it a raw qPCR Ct table and it runs.
- In one sentence: compute relative mitochondrial DNA copy number from four Ct values (ND1 / ND5 / B2M / POLG) — automatically applies Mean copy number = (2^(B2M-ND1) + 2^(POLG-ND5)) / 2, with automatic statistics (t-test for 2 groups; Tukey HSD for ≥3 groups) and a 300 dpi barplot.
- This skill uses Python (not R) — environment setup is much lighter than the RNA-seq family.
Tutorial structure:
- Step 1 | Install the qpcr-mtdna skill (one time only)
- Step 2 | Set up the runtime environment (one time only)
- Step 3 | Run the bundled example data
- Step 4 | Switch to your own data
- Step 5 | Let the AI interpret the results
- More analysis | Related skills (qPCR mRNA / grouped barplot)
Step 1 | Install the qpcr-mtdna skill
Paste this prompt:
Please install the "qpcr-mtdna" skill for me, into the D:\claw2bio folder:
1. Create a folder named claw2bio in the root of the D: drive (if it doesn't exist yet).
2. From the GitHub repository https://github.com/nihuanhe/claw2bio, fetch ONLY the folder
   experiment-data/qpcr-mtdna (use sparse checkout — do NOT clone the whole repository),
   and place it at D:\claw2bio\qpcr-mtdna.
3. If downloading from GitHub fails or is too slow, download the zip from this mirror link instead:
   https://claw2bio.site/downloads/qpcr-mtdna.zip
   and extract it to D:\claw2bio\qpcr-mtdna.
4. Read the SKILL.md inside, then confirm to me that the skill is ready and list the contents
   of the folder.
(If my PC has no D: drive, install to C:\claw2bio instead and tell me the actual path.)
When Step 1 finishes, open the file manager and confirm that D:\claw2bio\qpcr-mtdna exists, with scripts/, examples/, SKILL.md, etc. inside.
Step 2 | Set up the runtime environment
Paste this prompt:
Please set up the runtime environment for the "qpcr-mtdna" skill at D:\claw2bio\qpcr-mtdna:
1. First, SEARCH THIS PC for an existing Python installation. If Python is already installed,
   report its version to me. Only if Python is NOT installed at all, install a recent Python 3
   (Windows), downloaded from the official python.org website, accepting all default options —
   and make sure to check "Add python.exe to PATH" during installation.
2. Install all Python packages this skill needs: pandas, numpy, scipy, matplotlib
   (use pip; if a package fails or is too slow, stop and tell me about it).
3. When everything is installed, confirm to me that the skill can run.
When Step 2 finishes, the AI agent will tell you your Python version and the dependency installation result.
Step 3 | Run the bundled example data
Paste this prompt:
The skill is installed at D:\claw2bio\qpcr-mtdna. Please run the bundled example:
1. Example input is at D:\claw2bio\qpcr-mtdna\examples\input\mtDNA-input.csv
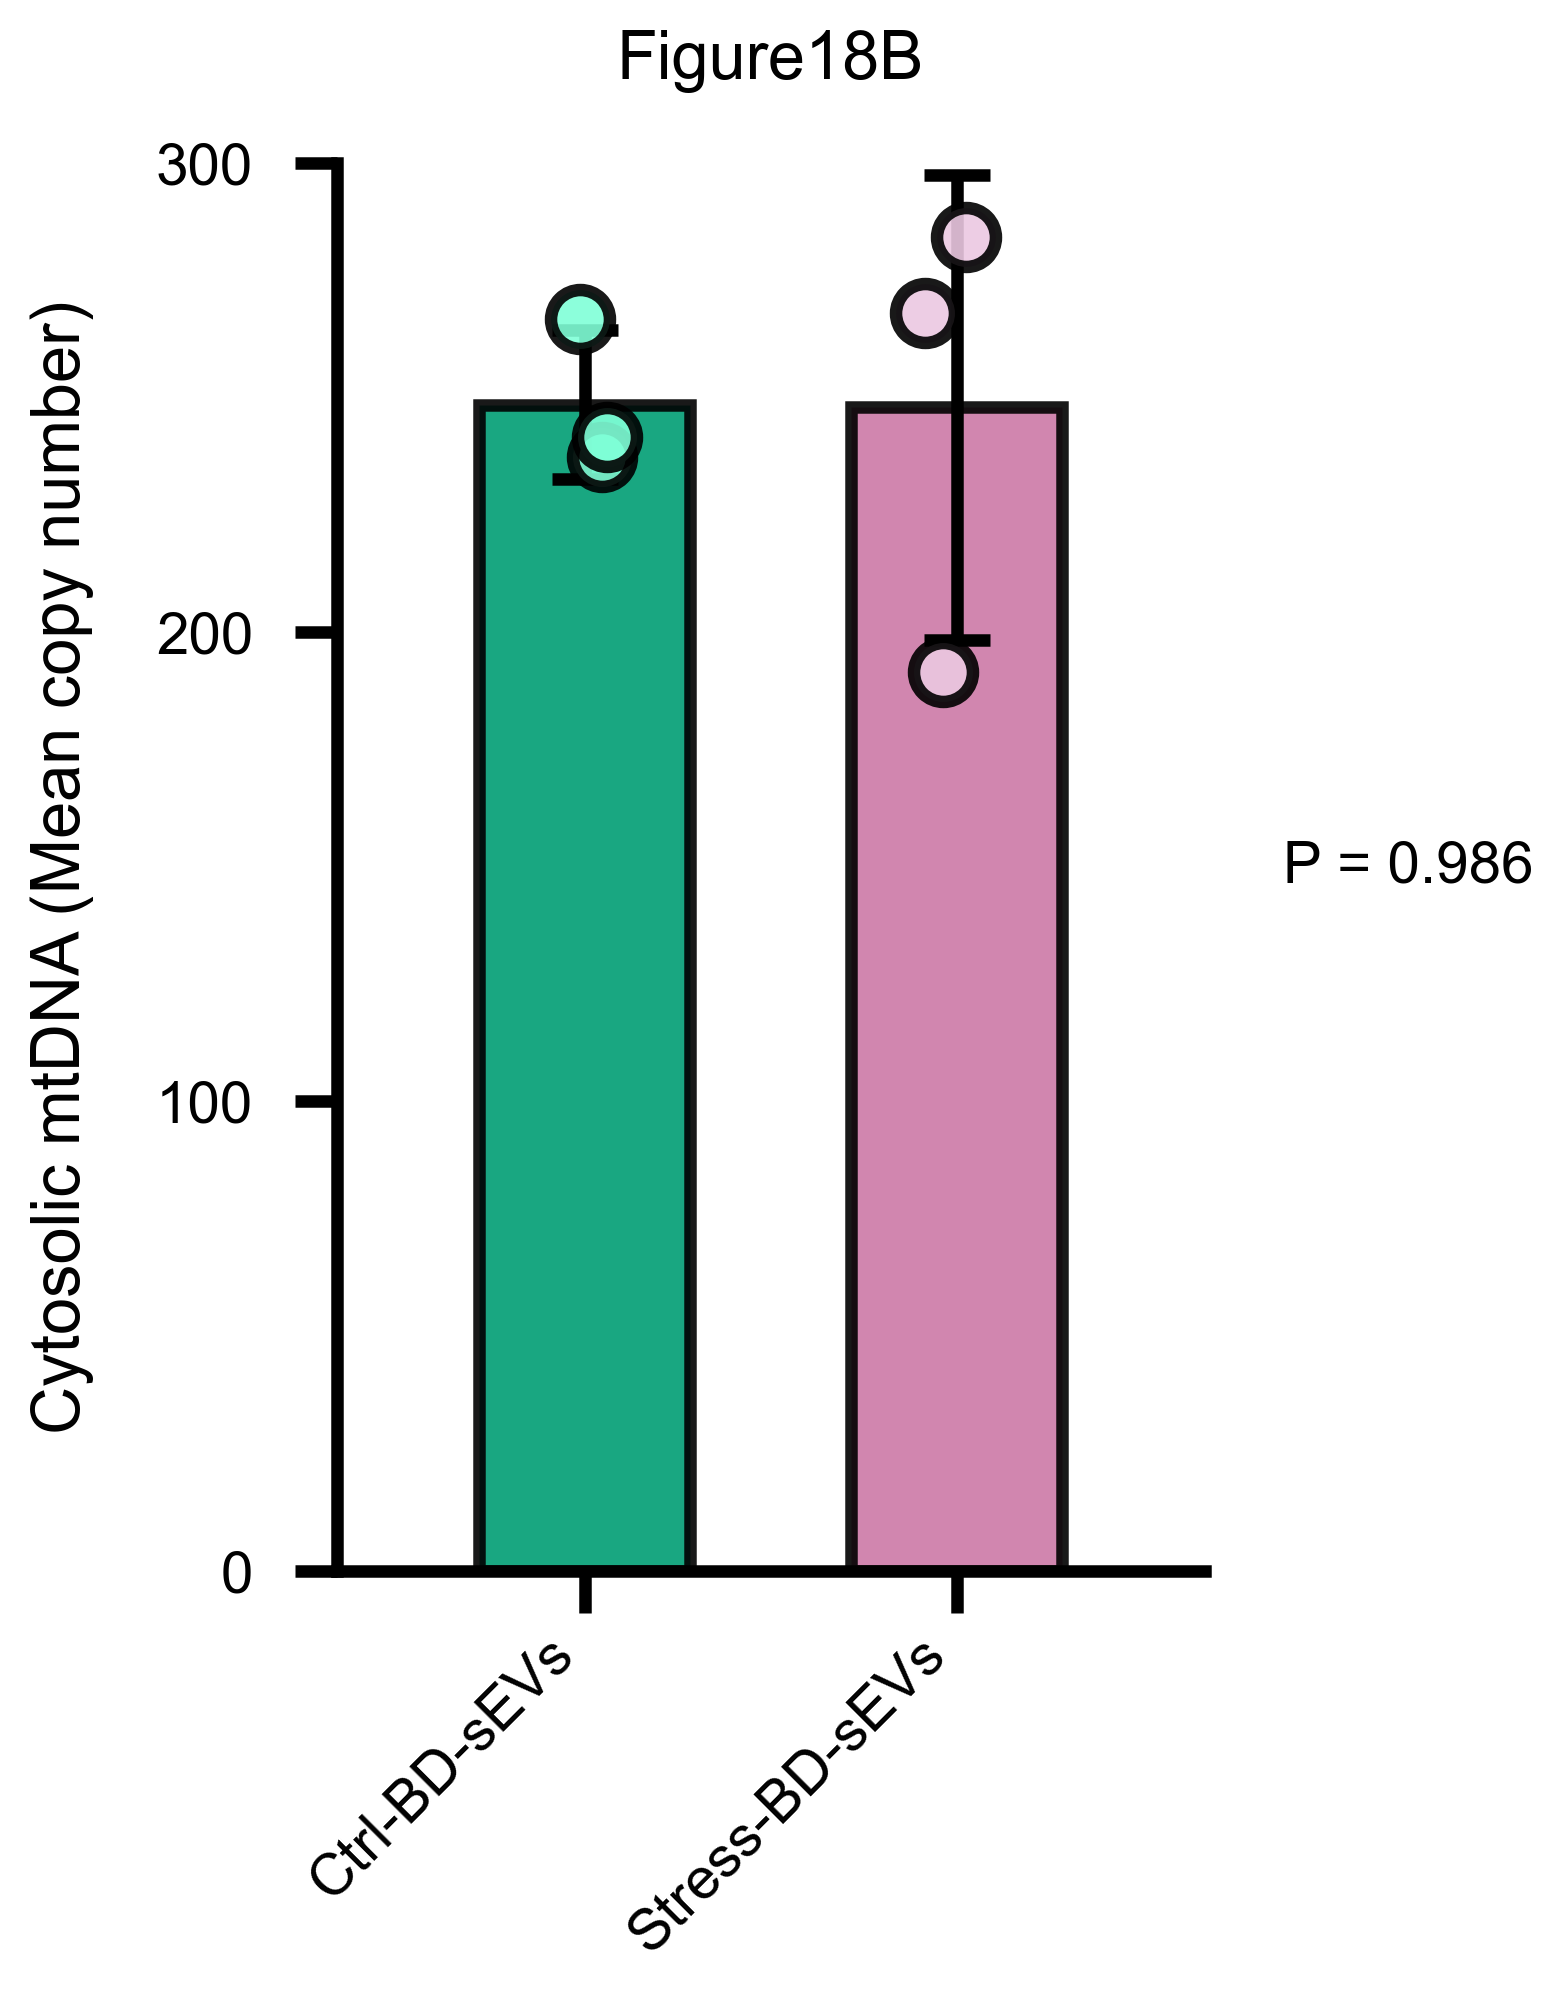
2. Write results to D:\claw2bio\qpcr-mtdna\examples\output\ with the output name "Figure18B".
3. Prefer the skill's own scripts in scripts/ — do NOT write new analysis code from scratch.
4. When the run succeeds, show me the result barplot and the Figure18B.csv table; explain
   both to me.
When the run succeeds, you get one 300 dpi barplot with statistics and a result table with ΔCt / 2^ΔCt / Mean copy number columns. Anchor result for the example data: P = 0.986 (ns, not significant) — if your result matches, the environment and pipeline are working correctly.
Step 4 | Switch to your own data
Hand over your own raw Ct table. Hard format requirement: the table MUST contain exactly these four Target rows — ND1 Ct, ND5 Ct, B2M Ct, POLG Ct (note the "Ct" suffix) — each with columns Target, Sample, Rep1, Rep2, Rep3. Paste this prompt:
My own mtDNA qPCR Ct table is at: <paste the path to your CSV file here>.
1. First check whether my table has any format problems — it MUST contain exactly these four
   Target rows: "ND1 Ct", "ND5 Ct", "B2M Ct", "POLG Ct" (note the "Ct" suffix), each with
   columns Target, Sample, Rep1, Rep2, Rep3. If anything is missing or misspelled, fix it and
   tell me what you did.
2. Once the data checks out, run the full mtDNA copy-number analysis with the output name
   <e.g., Figure3>, and show me the result barplot plus the result CSV.
3. Prefer the skill's own scripts in scripts/; if anything needs adapting, make the smallest
   possible change — do NOT write large amounts of new code.
4. If you see that I have MANY input CSV files in one folder, tell me that the skill also has
   a batch script (scripts/batch_mtdna.py) that can process a whole directory at once, and ask
   me whether I want batch mode.
Wait for the AI agent to finish: one 300 dpi barplot with statistics (t-test for 2 groups; Tukey HSD for ≥3 groups), plus a result CSV with ΔCt / 2^ΔCt / Mean copy number columns.
Step 5 | Let the AI interpret the results
Paste this prompt:
Please explain the result CSV and the barplot in my output folder line by line:
1. What each column in the CSV means (raw Ct, Delta Ct, 2^Delta Ct, Mean copy number);
2. Explain the formula Mean copy number = (2^(B2M-ND1) + 2^(POLG-ND5)) / 2 in plain language —
   why ND1/ND5 are the mitochondrial targets and B2M/POLG the nuclear references;
3. How the mtDNA copy number differs between my groups, and whether the difference is
   statistically significant (which test was used and why);
4. Any warnings or things I should pay attention to (e.g., high Ct replicate variation).
After explaining, tell me which figures can be used directly in a paper or presentation.
After reading the AI's explanation, if anything is unclear, just ask it directly.
More analysis
This skill only does mtDNA relative copy-number analysis. The two skills below are related and installed in exactly the same way (one-click prompt or zip download from the website):
qPCR mRNA (ΔΔCt) — qpcr-mrna
One sentence: ΔΔCt relative-expression analysis — from a raw Ct table straight to one publication-grade barplot per target gene. Automatic normalization against the reference gene, automatic statistics.
Details & download: /skills/qpcr-mrna
Grouped barplot — barplot
One sentence: any 2–6 group experimental data (ELISA, WB densitometry, cell counts…) → barplot with statistics in one shot. Just give it a wide-format CSV; the statistical method is chosen automatically.
Details & download: /skills/barplot