
Clinical Tables
One-line: patient-level CSV in — publication-ready three-line tables out. Fully validated on all 10 tables (Table 1–10 = manuscript Table 1/2 + Supplemental S1–S8) of a real CRE/CSE cohort study: baseline comparison, Firth regression, genotype cross-tabs, univariate analysis, sequencing-quality table.
Get this skill · 获取本技能
Option A — one-click agent prompt (recommended). Copy this into your AI agent IDE:
Please set up the "clinical-table" skill from the Claw2Bio library for me:
1. Fetch only the folder "figure-generation/clinical-table" from the GitHub repo
   https://github.com/claw2bio/claw2bio (use sparse checkout; do not clone the whole repo).
2. Read its SKILL.md and register the skill.
3. Run the bundled example in examples/ to verify my environment, and show me the output tables.
Option B — standalone zip (few MB, Tencent COS direct link): coming soon — being packaged.
Option C — full example dataset (COS, per-skill folder): coming soon — being packaged.
What it does
Generic engine (Python, zero setup): two-cohort baseline table — categorical n (%) + Pearson χ² (Fisher's exact when any expected cell < 5) + continuous mean ± SD + Student's t-test; plus correlation matrix, Cox regression, OR summary.
Full manuscript table suite (R pipeline): 9 R scripts + 1 Python script in scripts/pipeline/; run in order to reproduce a paper's complete table set (Table 1–10 = manuscript main-text Tables 1–2 + supplemental S1–S8) from patient-level CSVs — baseline, Firth penalized logistic regression, resistance-gene/sequence-type/plasmid-replicon cross-tabs, univariate analysis, isolate sequencing-quality table.
Output is Markdown three-line tables, convertible to DOCX with Pandoc (pandoc output.md -o output.docx).
Example output (all 10 tables of a real cohort study, click to switch)
All ten figures below were produced by the skill's R pipeline from the pseudonymized patient-level data of a real CRE/CSE cohort study (manuscript under review); every cell was reconciled against the authors' independent recalculation scripts:
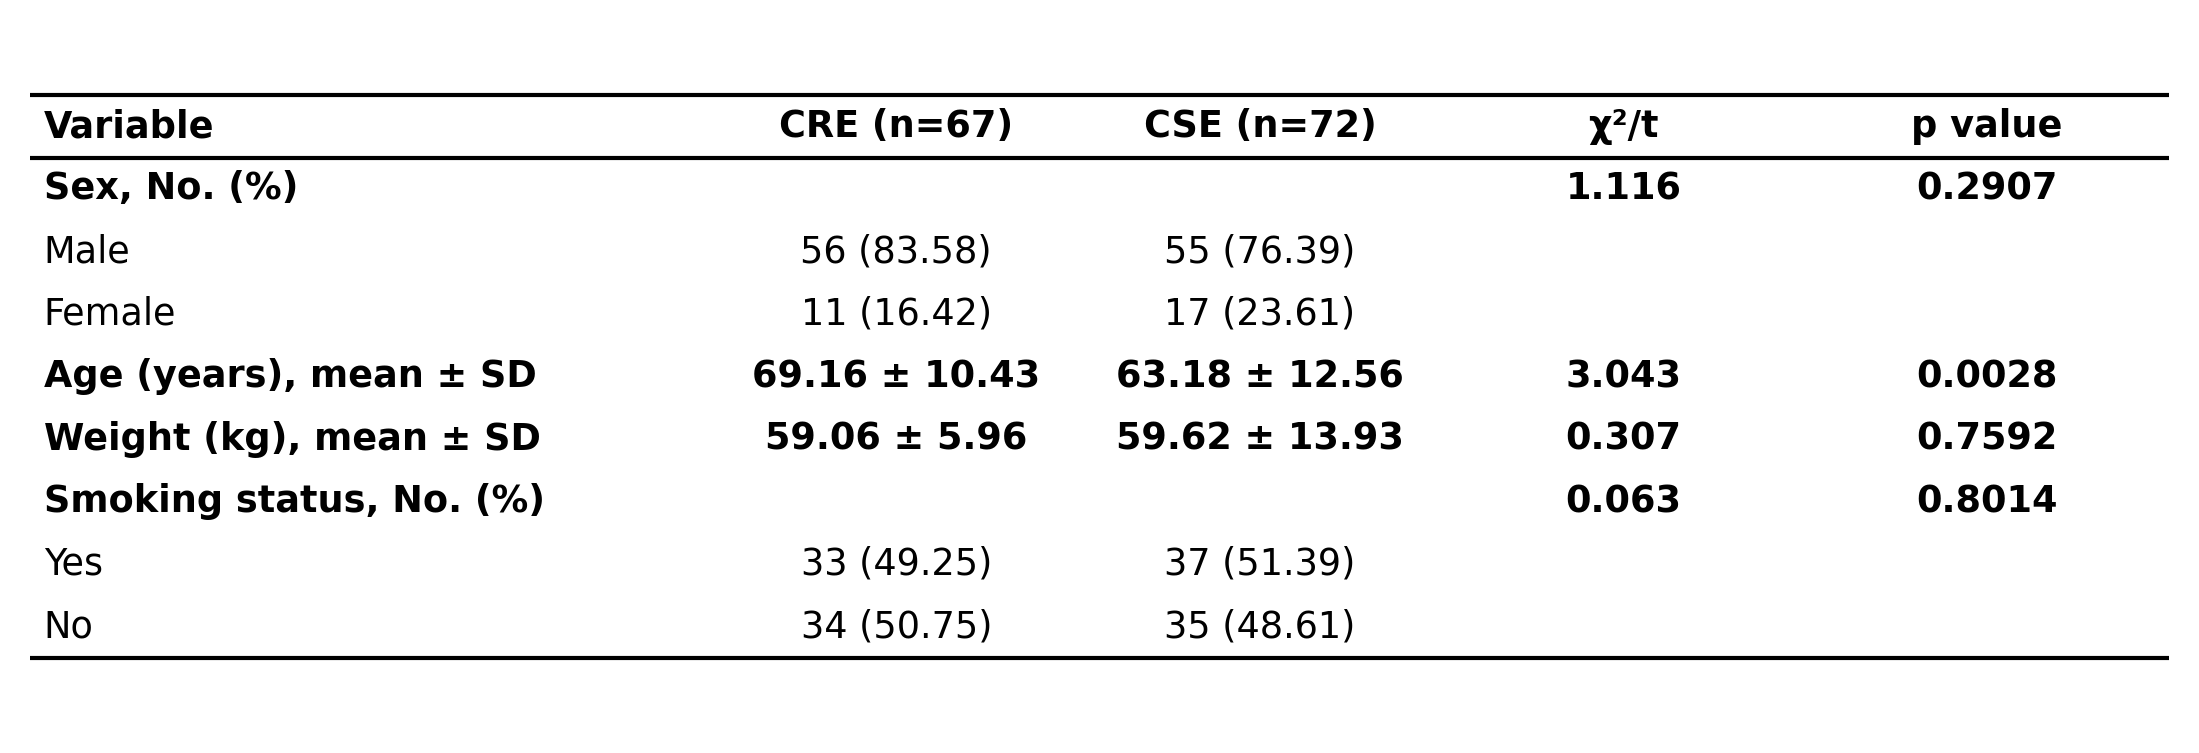
Table 1 · Baseline (= manuscript Table 1) · CRE (n=67) vs CSE (n=72) baseline characteristics: categorical χ²/Fisher + continuous Student's t. Age 69.16±10.43 vs 63.18±12.56 (p=0.0028); Sex p=0.2907. For hospital stay / intubation etc. see Table 2 and Table 8.
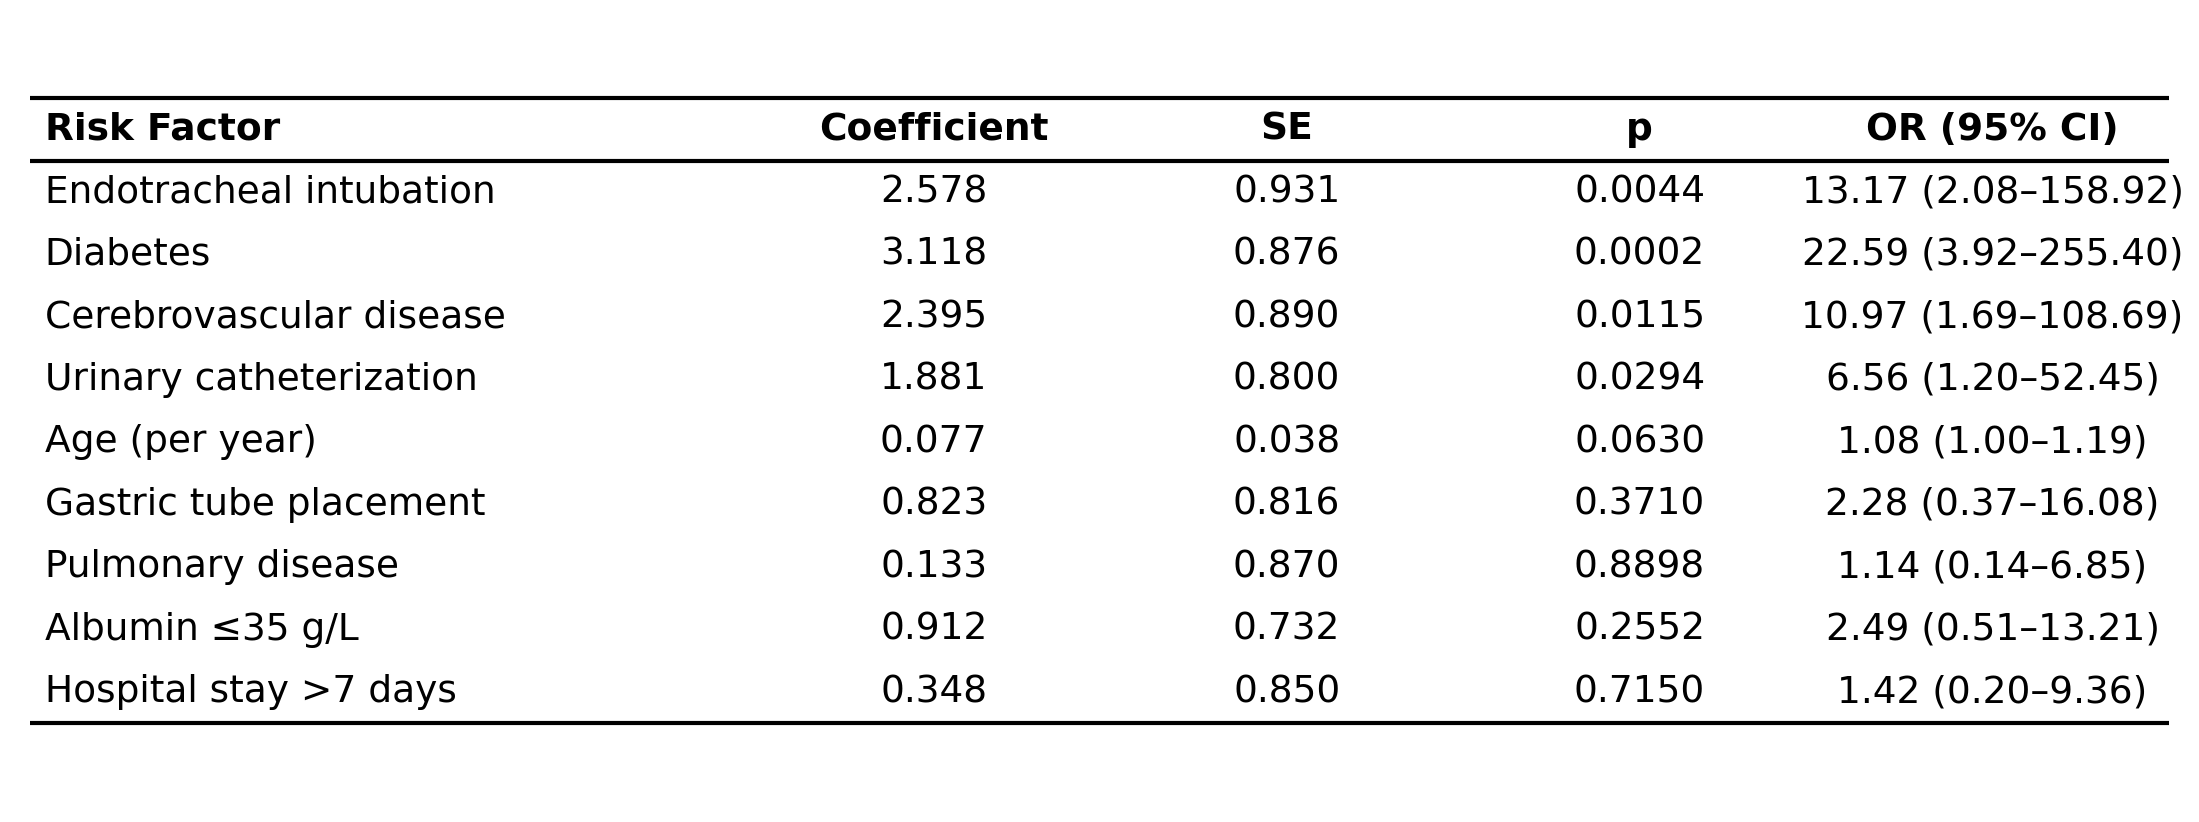
Table 2 · Firth (= manuscript Table 2) · Firth penalized multivariable logistic regression (CRE vs CSE, 9 covariates): robust inference for rare events, OR (95% CI) per row.
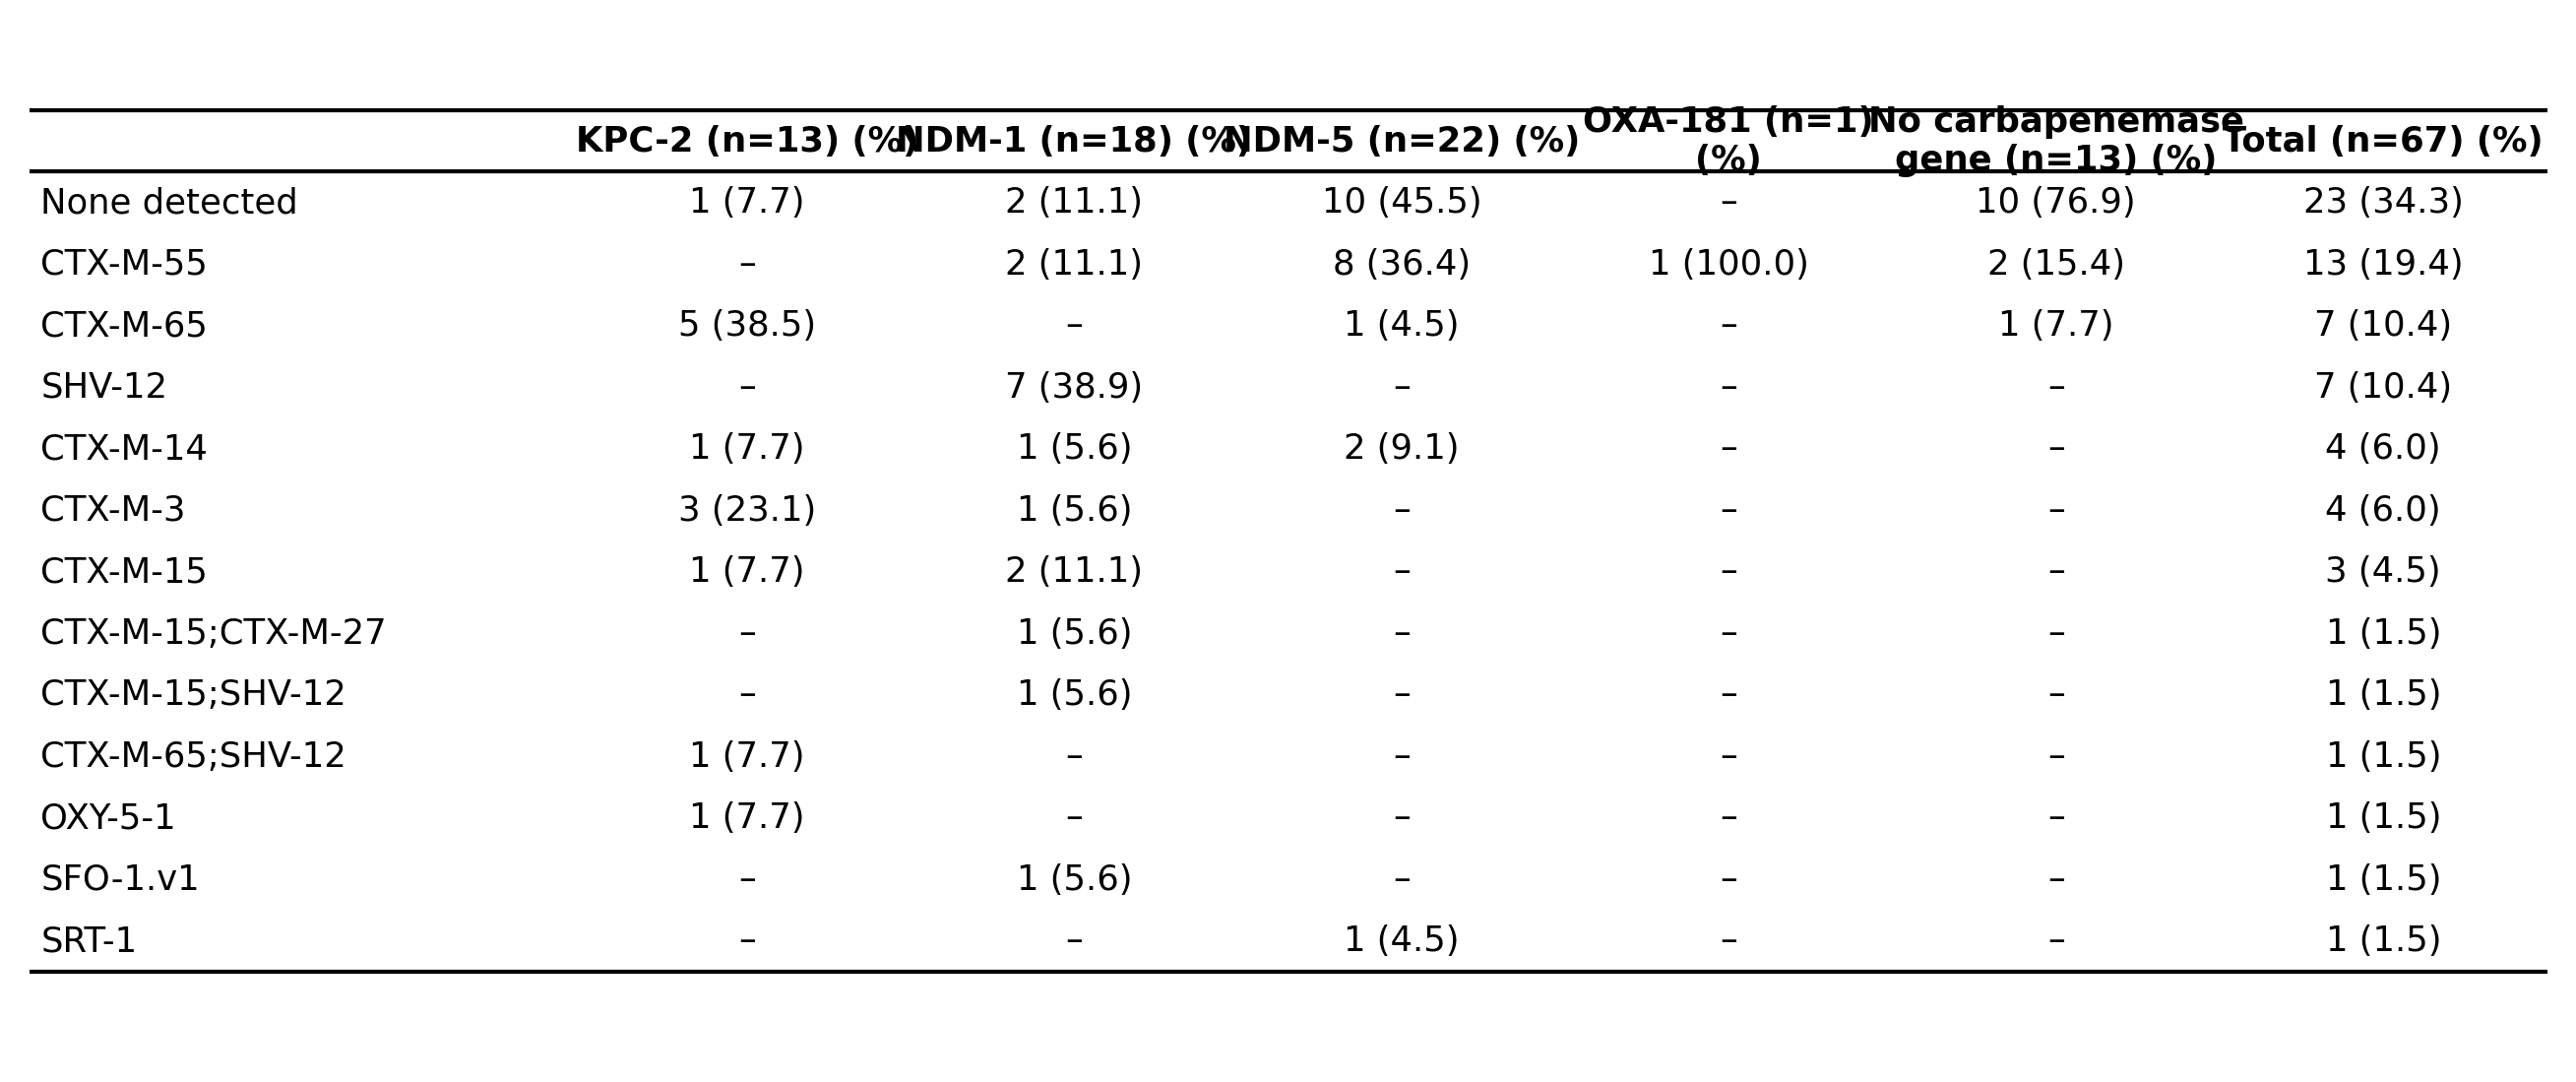
Table 3 · ESBL genes (= manuscript Supplemental Table S1) · Additional β-lactamase gene combinations in CRE isolates × carbapenemase groups (n (%), Kleborate flags stripped).
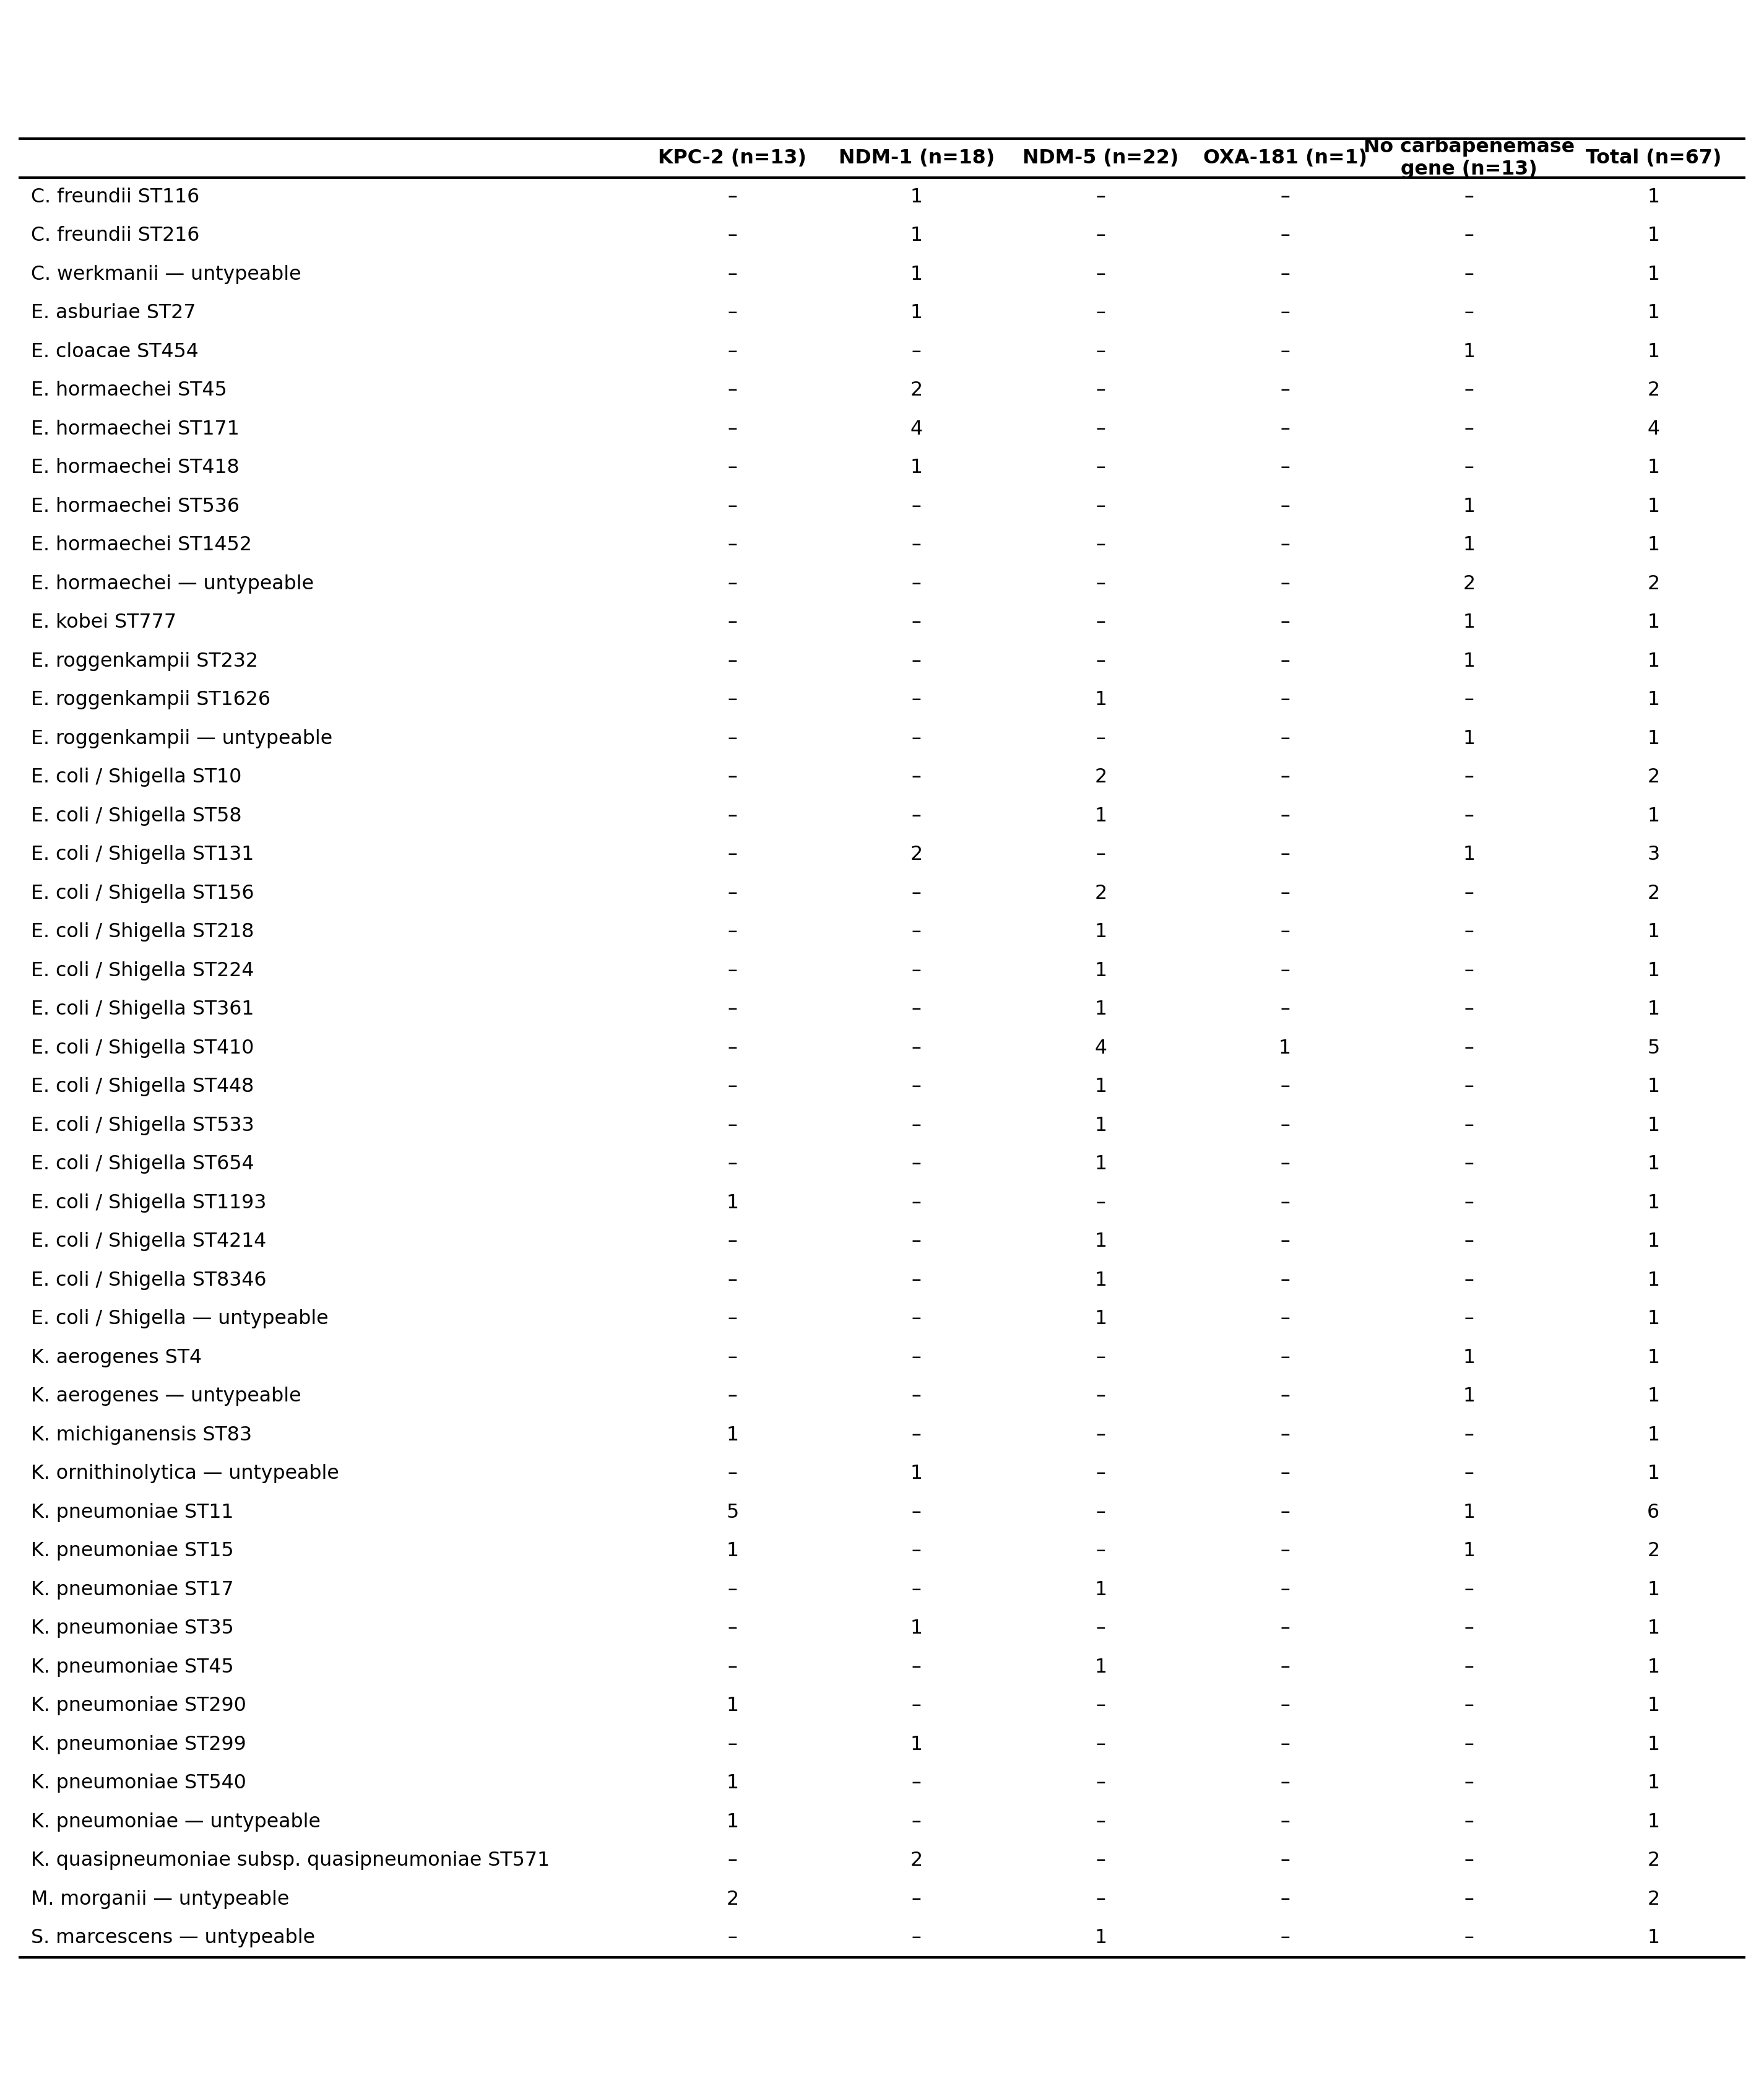
Table 4 · Sequence types (= manuscript Supplemental Table S2) · Species–ST combinations of CRE isolates × carbapenemase groups (46 rows, per-species untypeable rows).
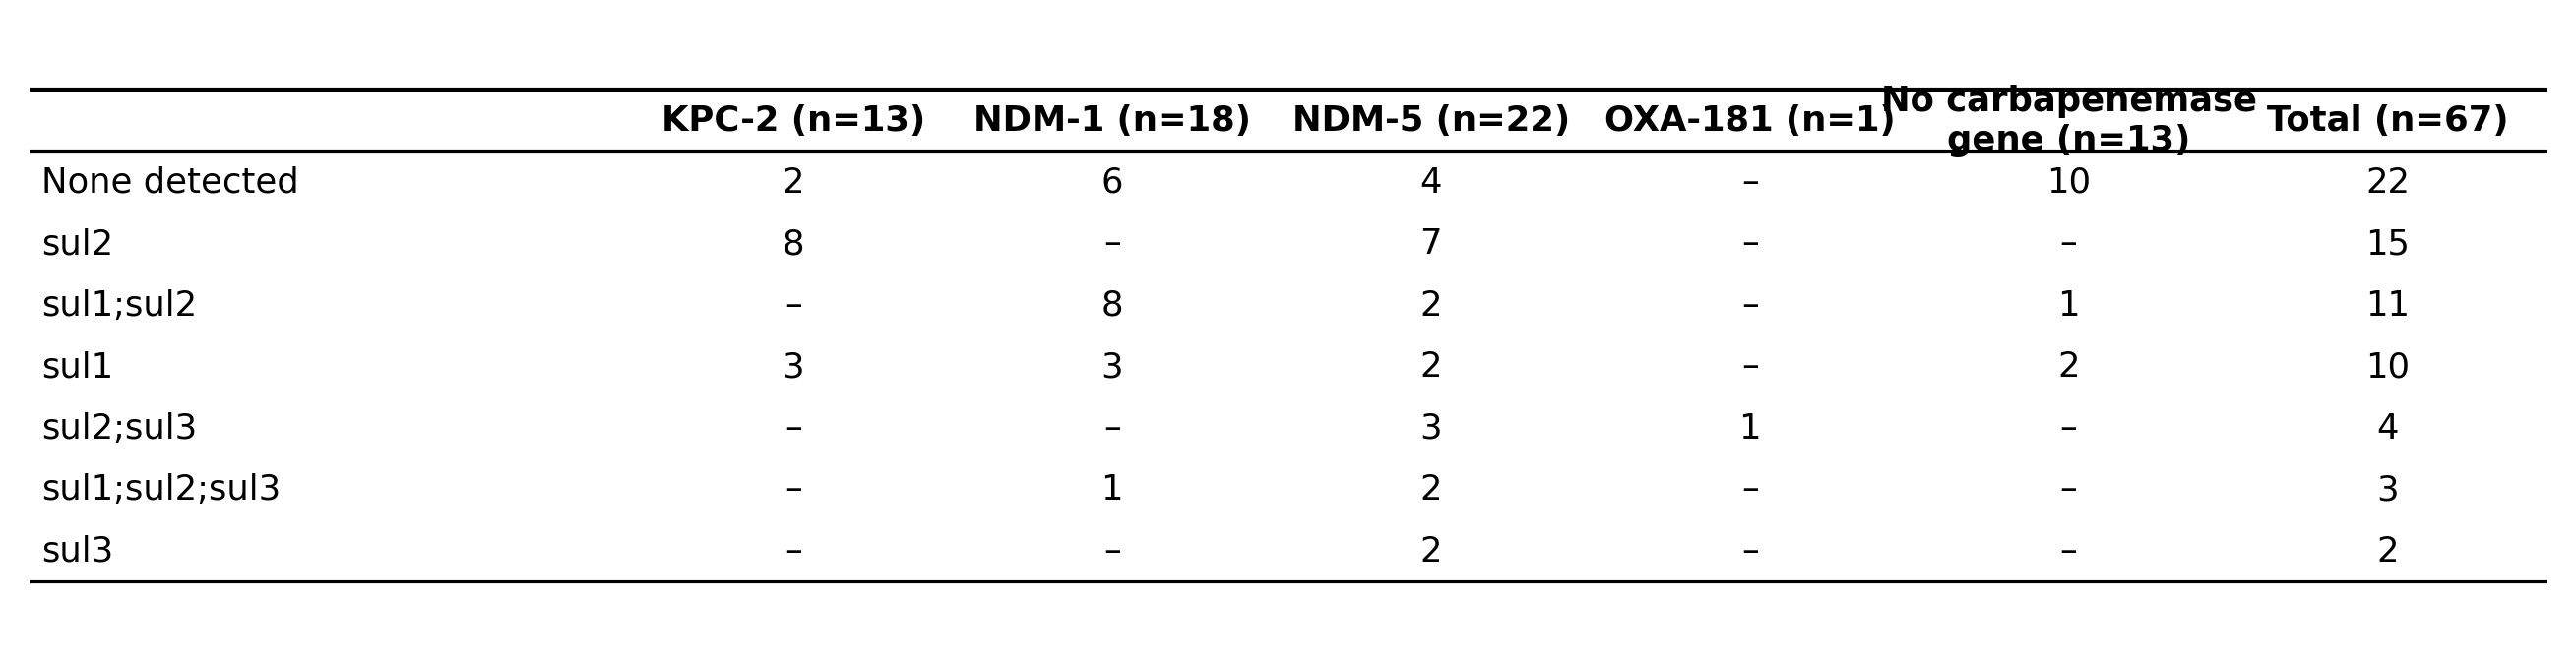
Table 5 · sul genes (= manuscript Supplemental Table S3) · Sulfonamide resistance gene (sul) combinations × carbapenemase groups.

Table 6 · Disease × genotype (= manuscript Supplemental Table S4) · Underlying disease distribution across CRE genotypes (diabetes / cerebrovascular / pulmonary disease).
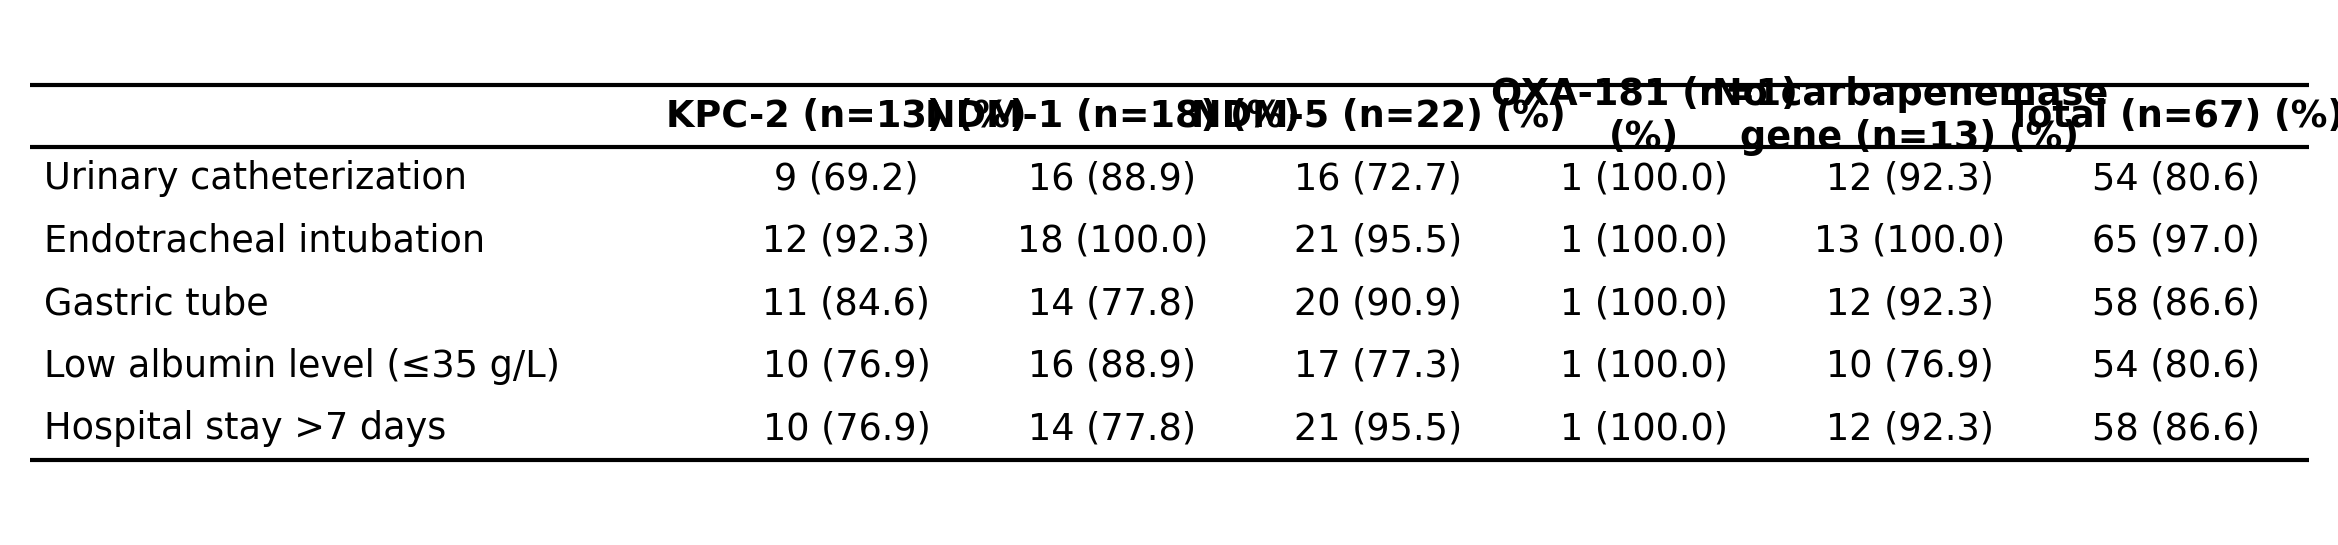
Table 7 · Procedures × genotype (= manuscript Supplemental Table S5) · Invasive procedures, albumin level, and hospital length of stay across CRE genotypes.
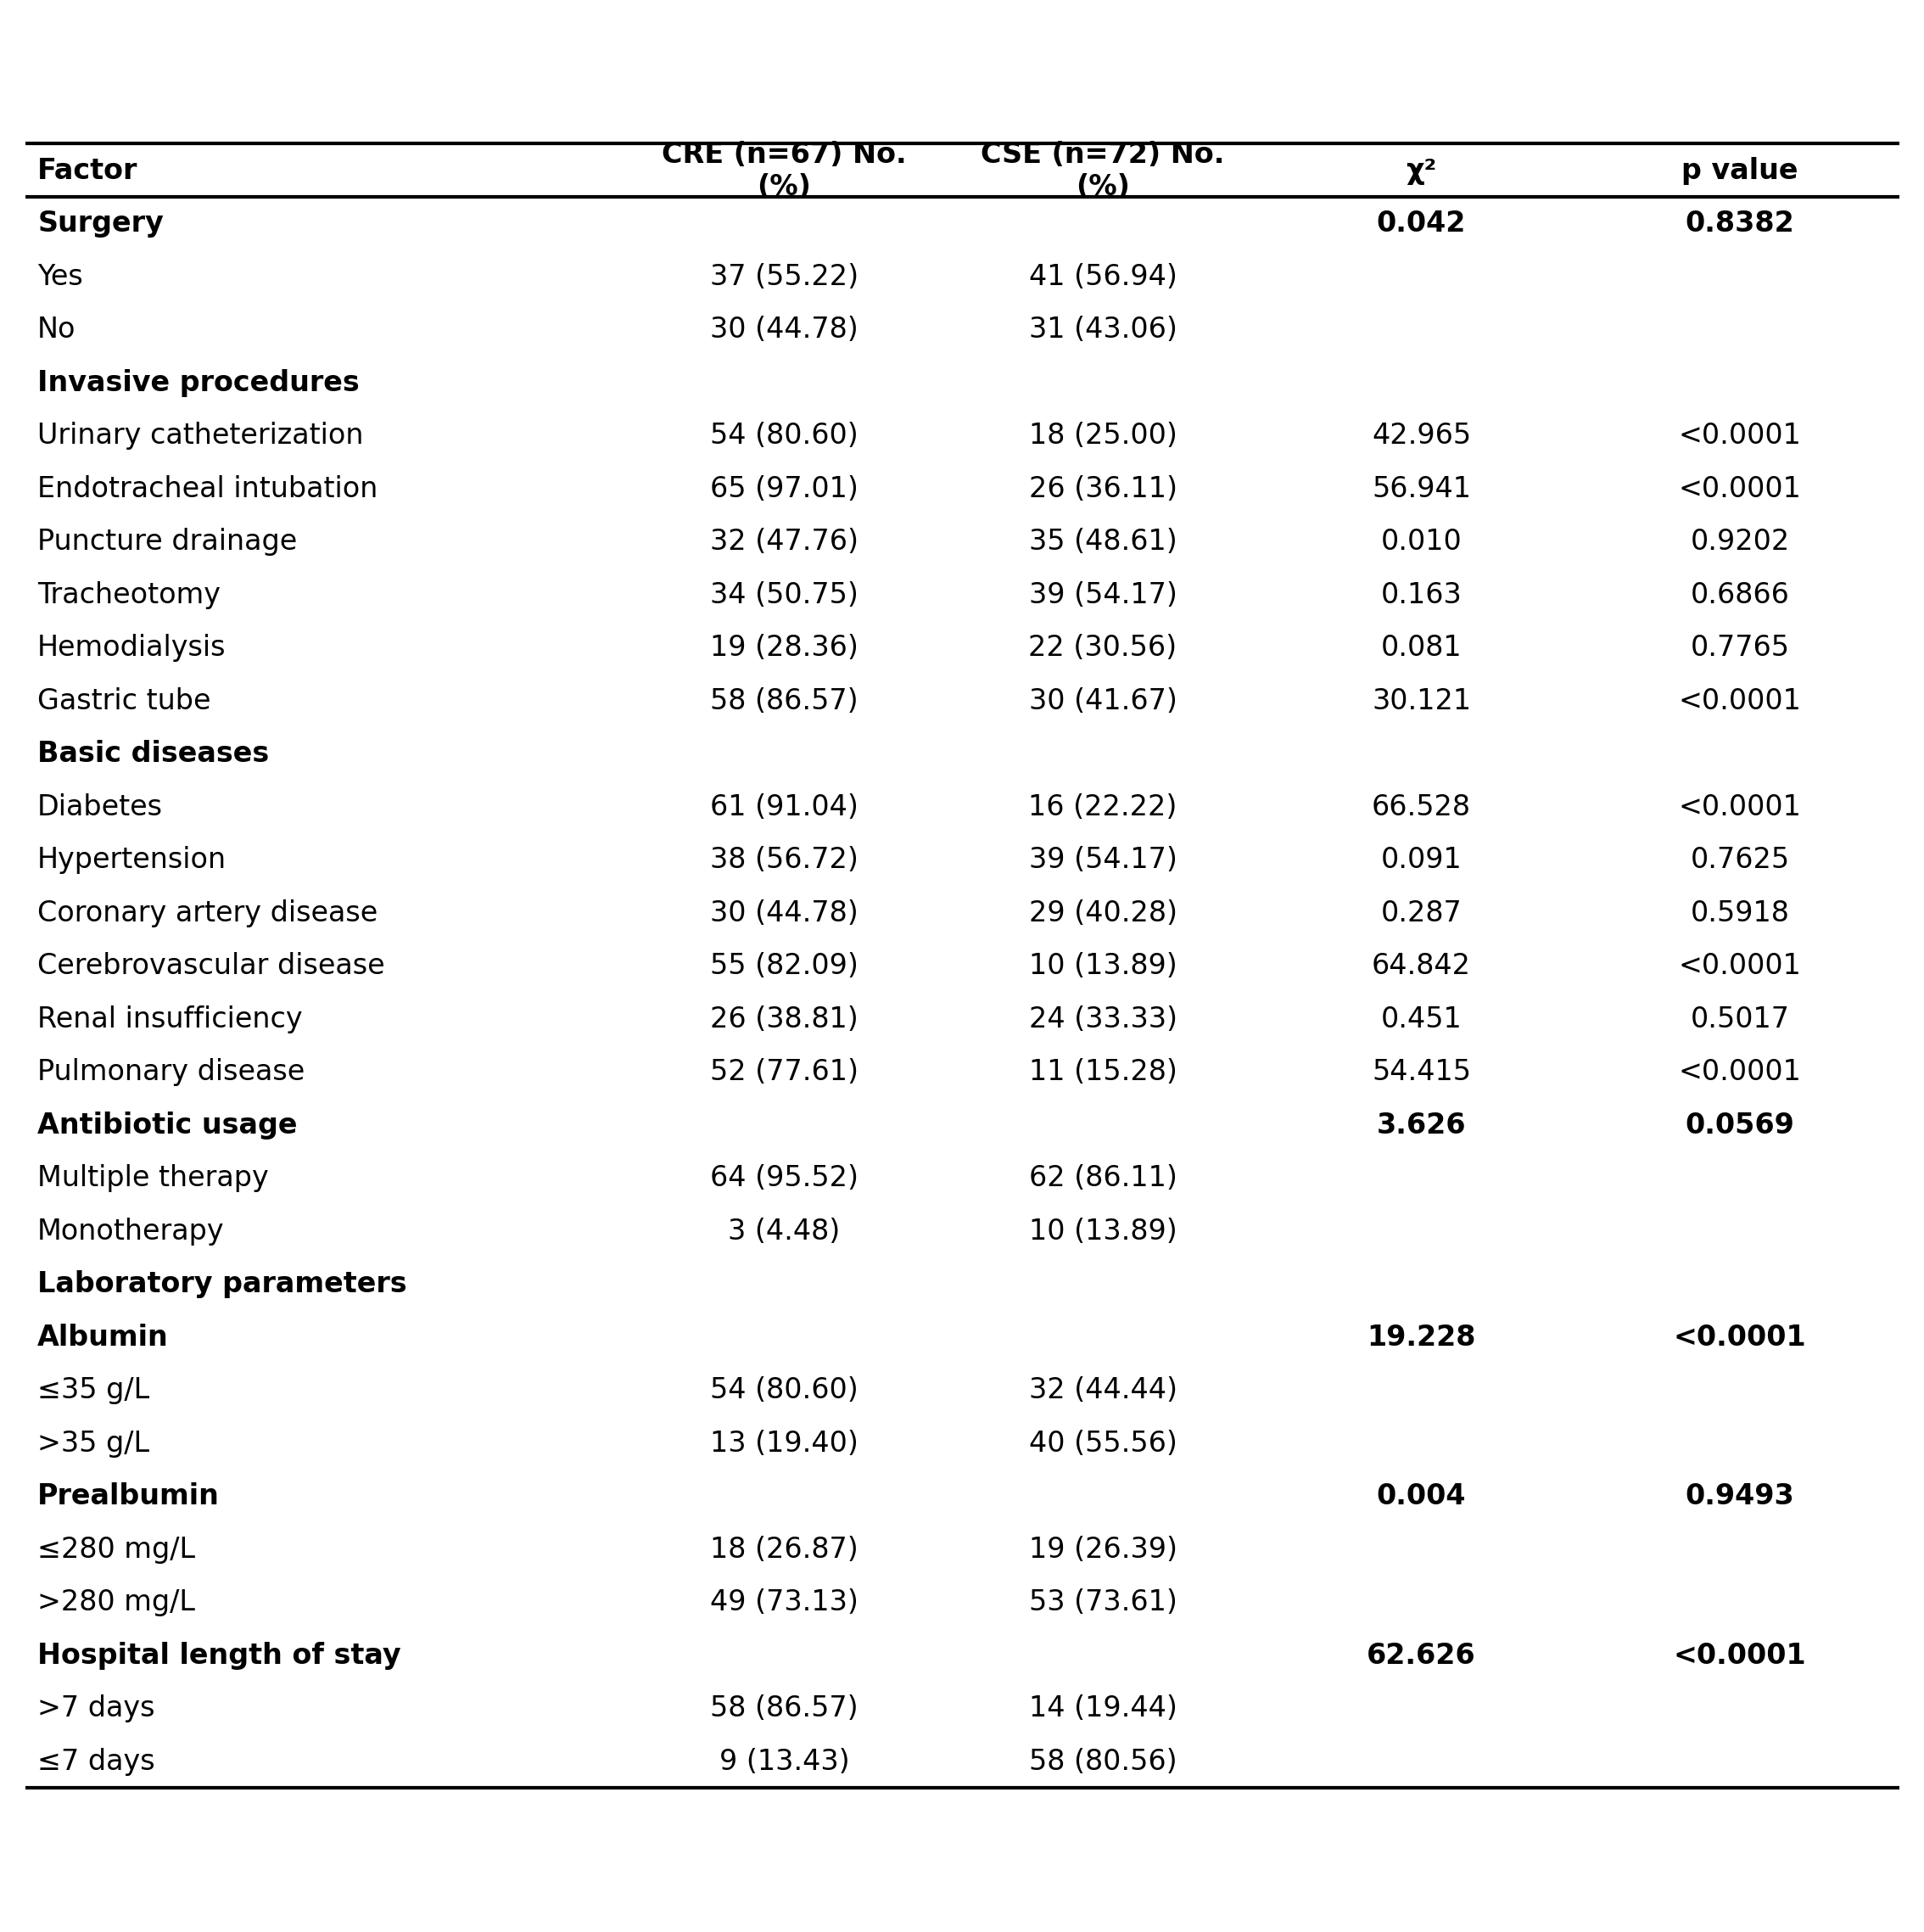
Table 8 · Univariate (= manuscript Supplemental Table S6) · Univariate analysis of factors associated with CRE infection (30 rows, χ²/Fisher auto-switch).
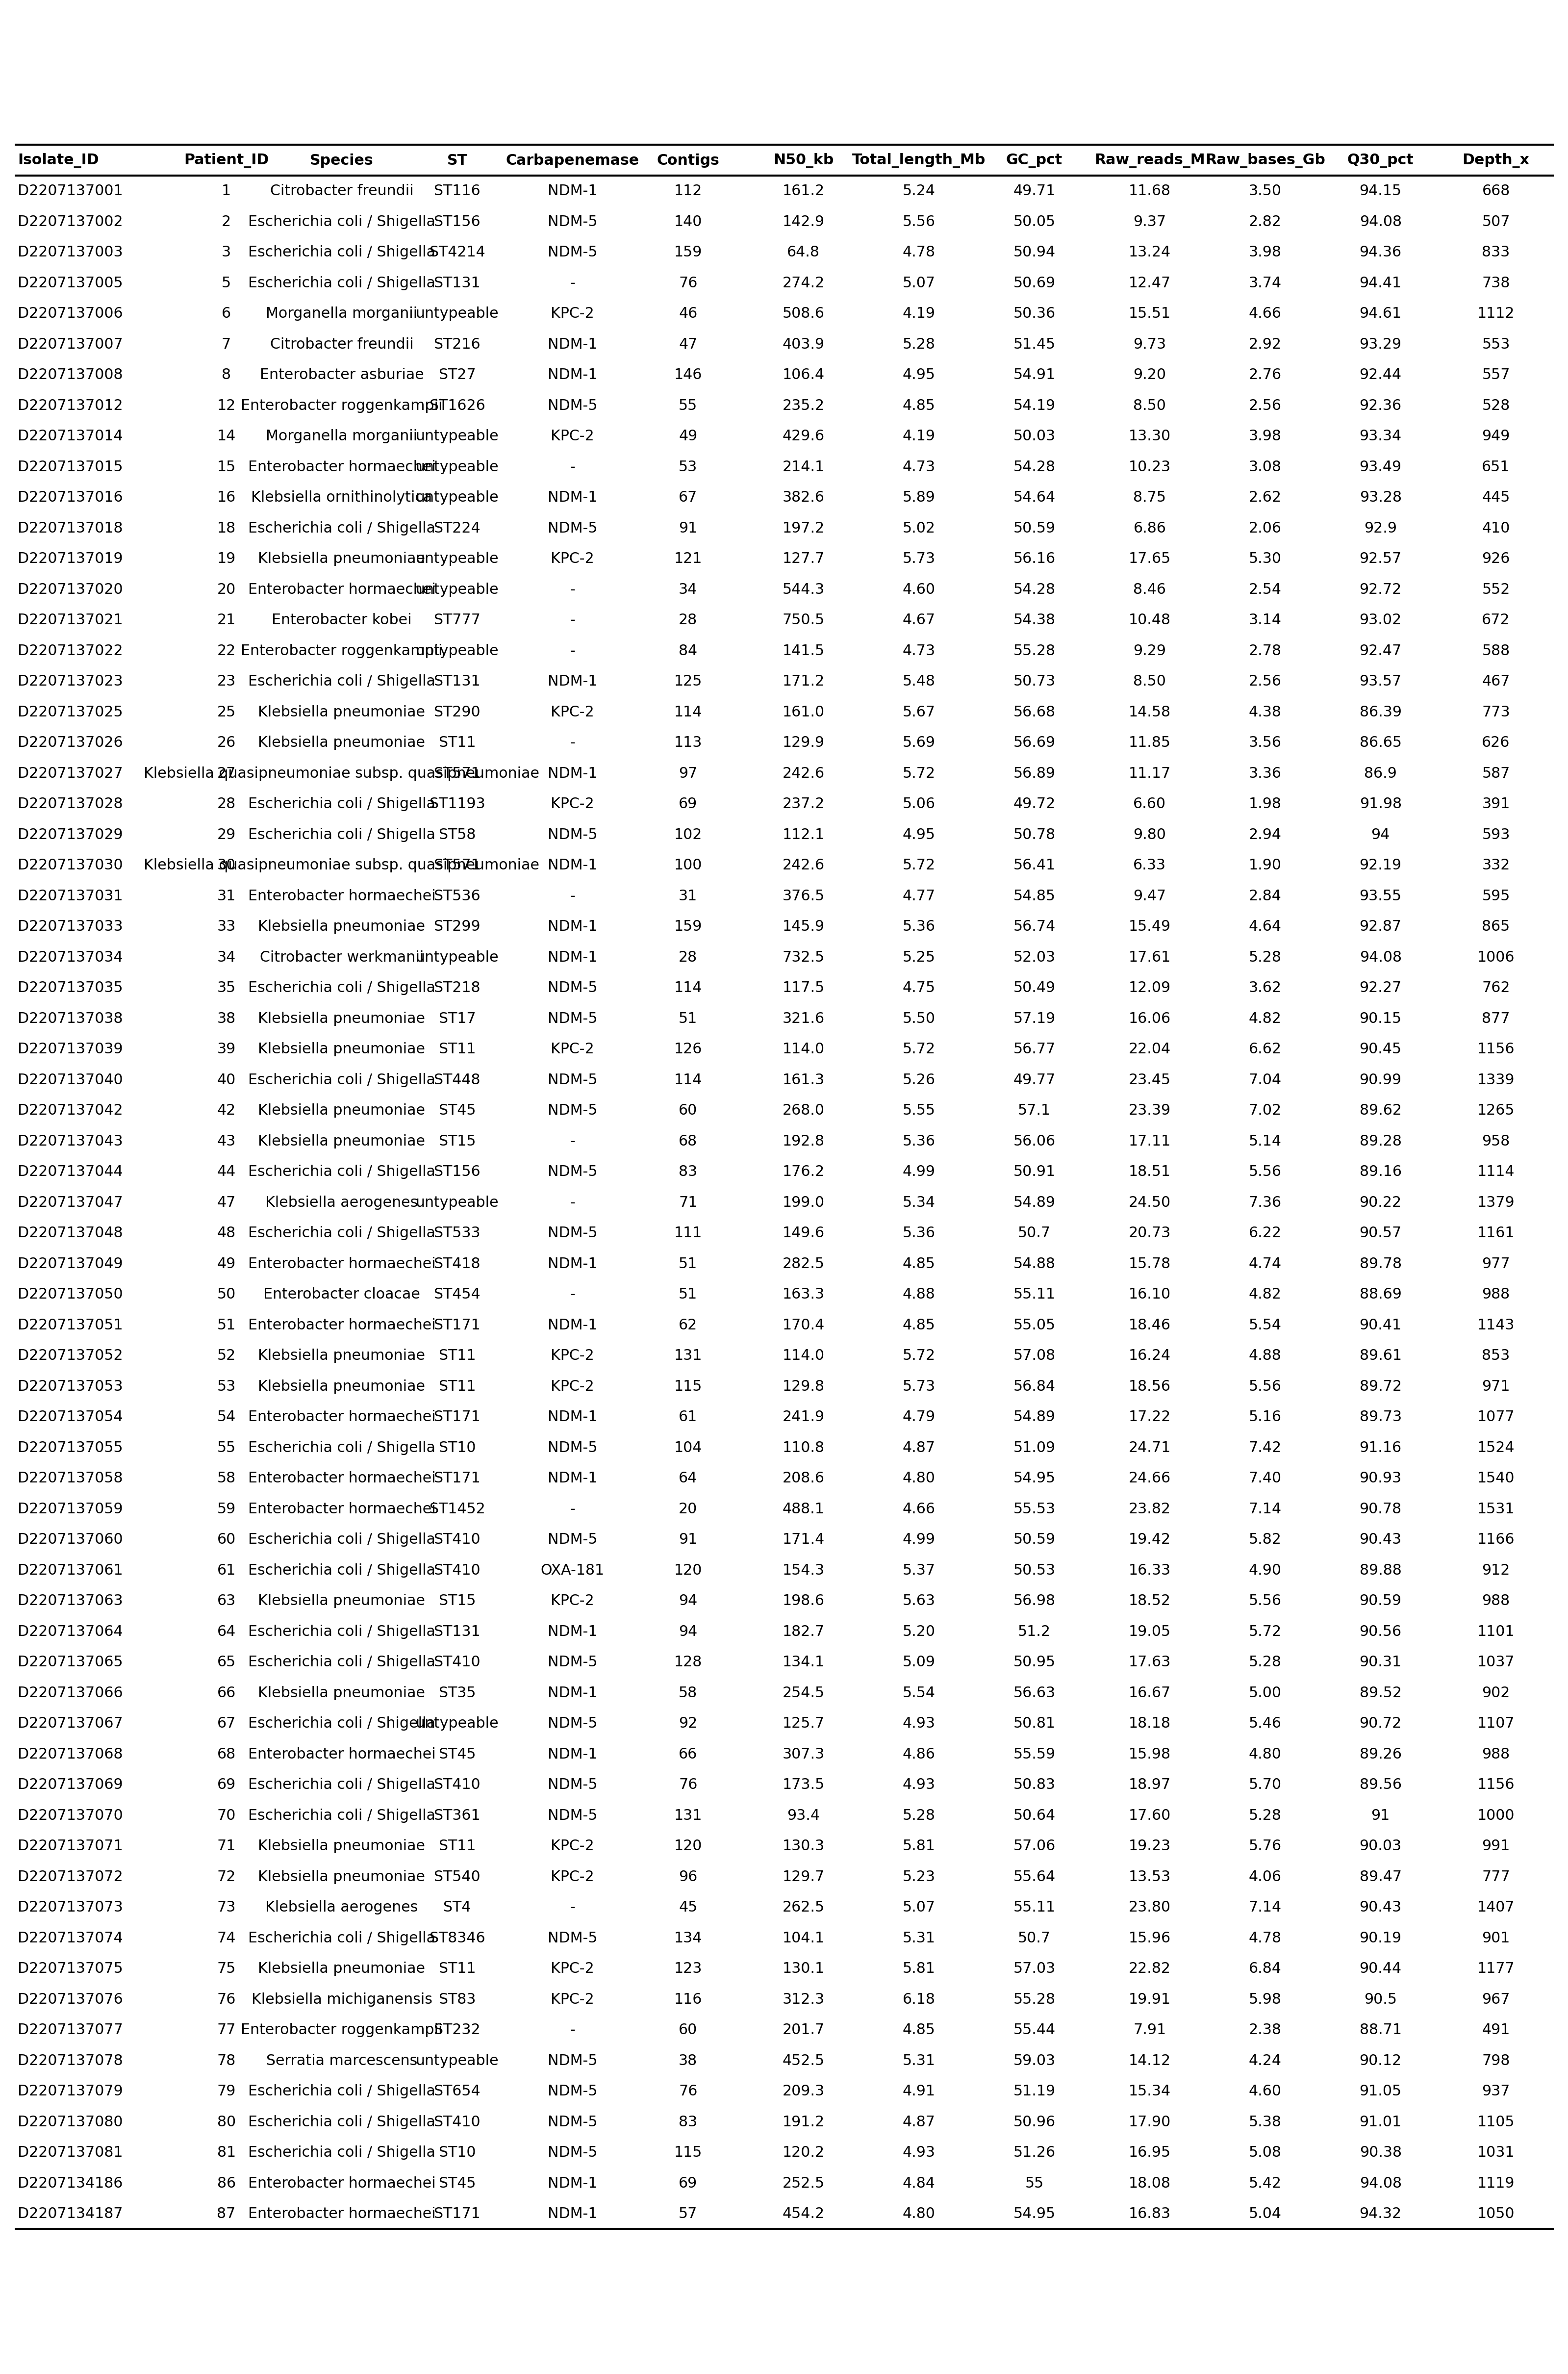
Table 9 · Sequencing quality (= manuscript Supplemental Table S7) · Sequencing quality metrics of the 67 CRE isolates (contigs/N50/GC/throughput/depth; standalone CSV).
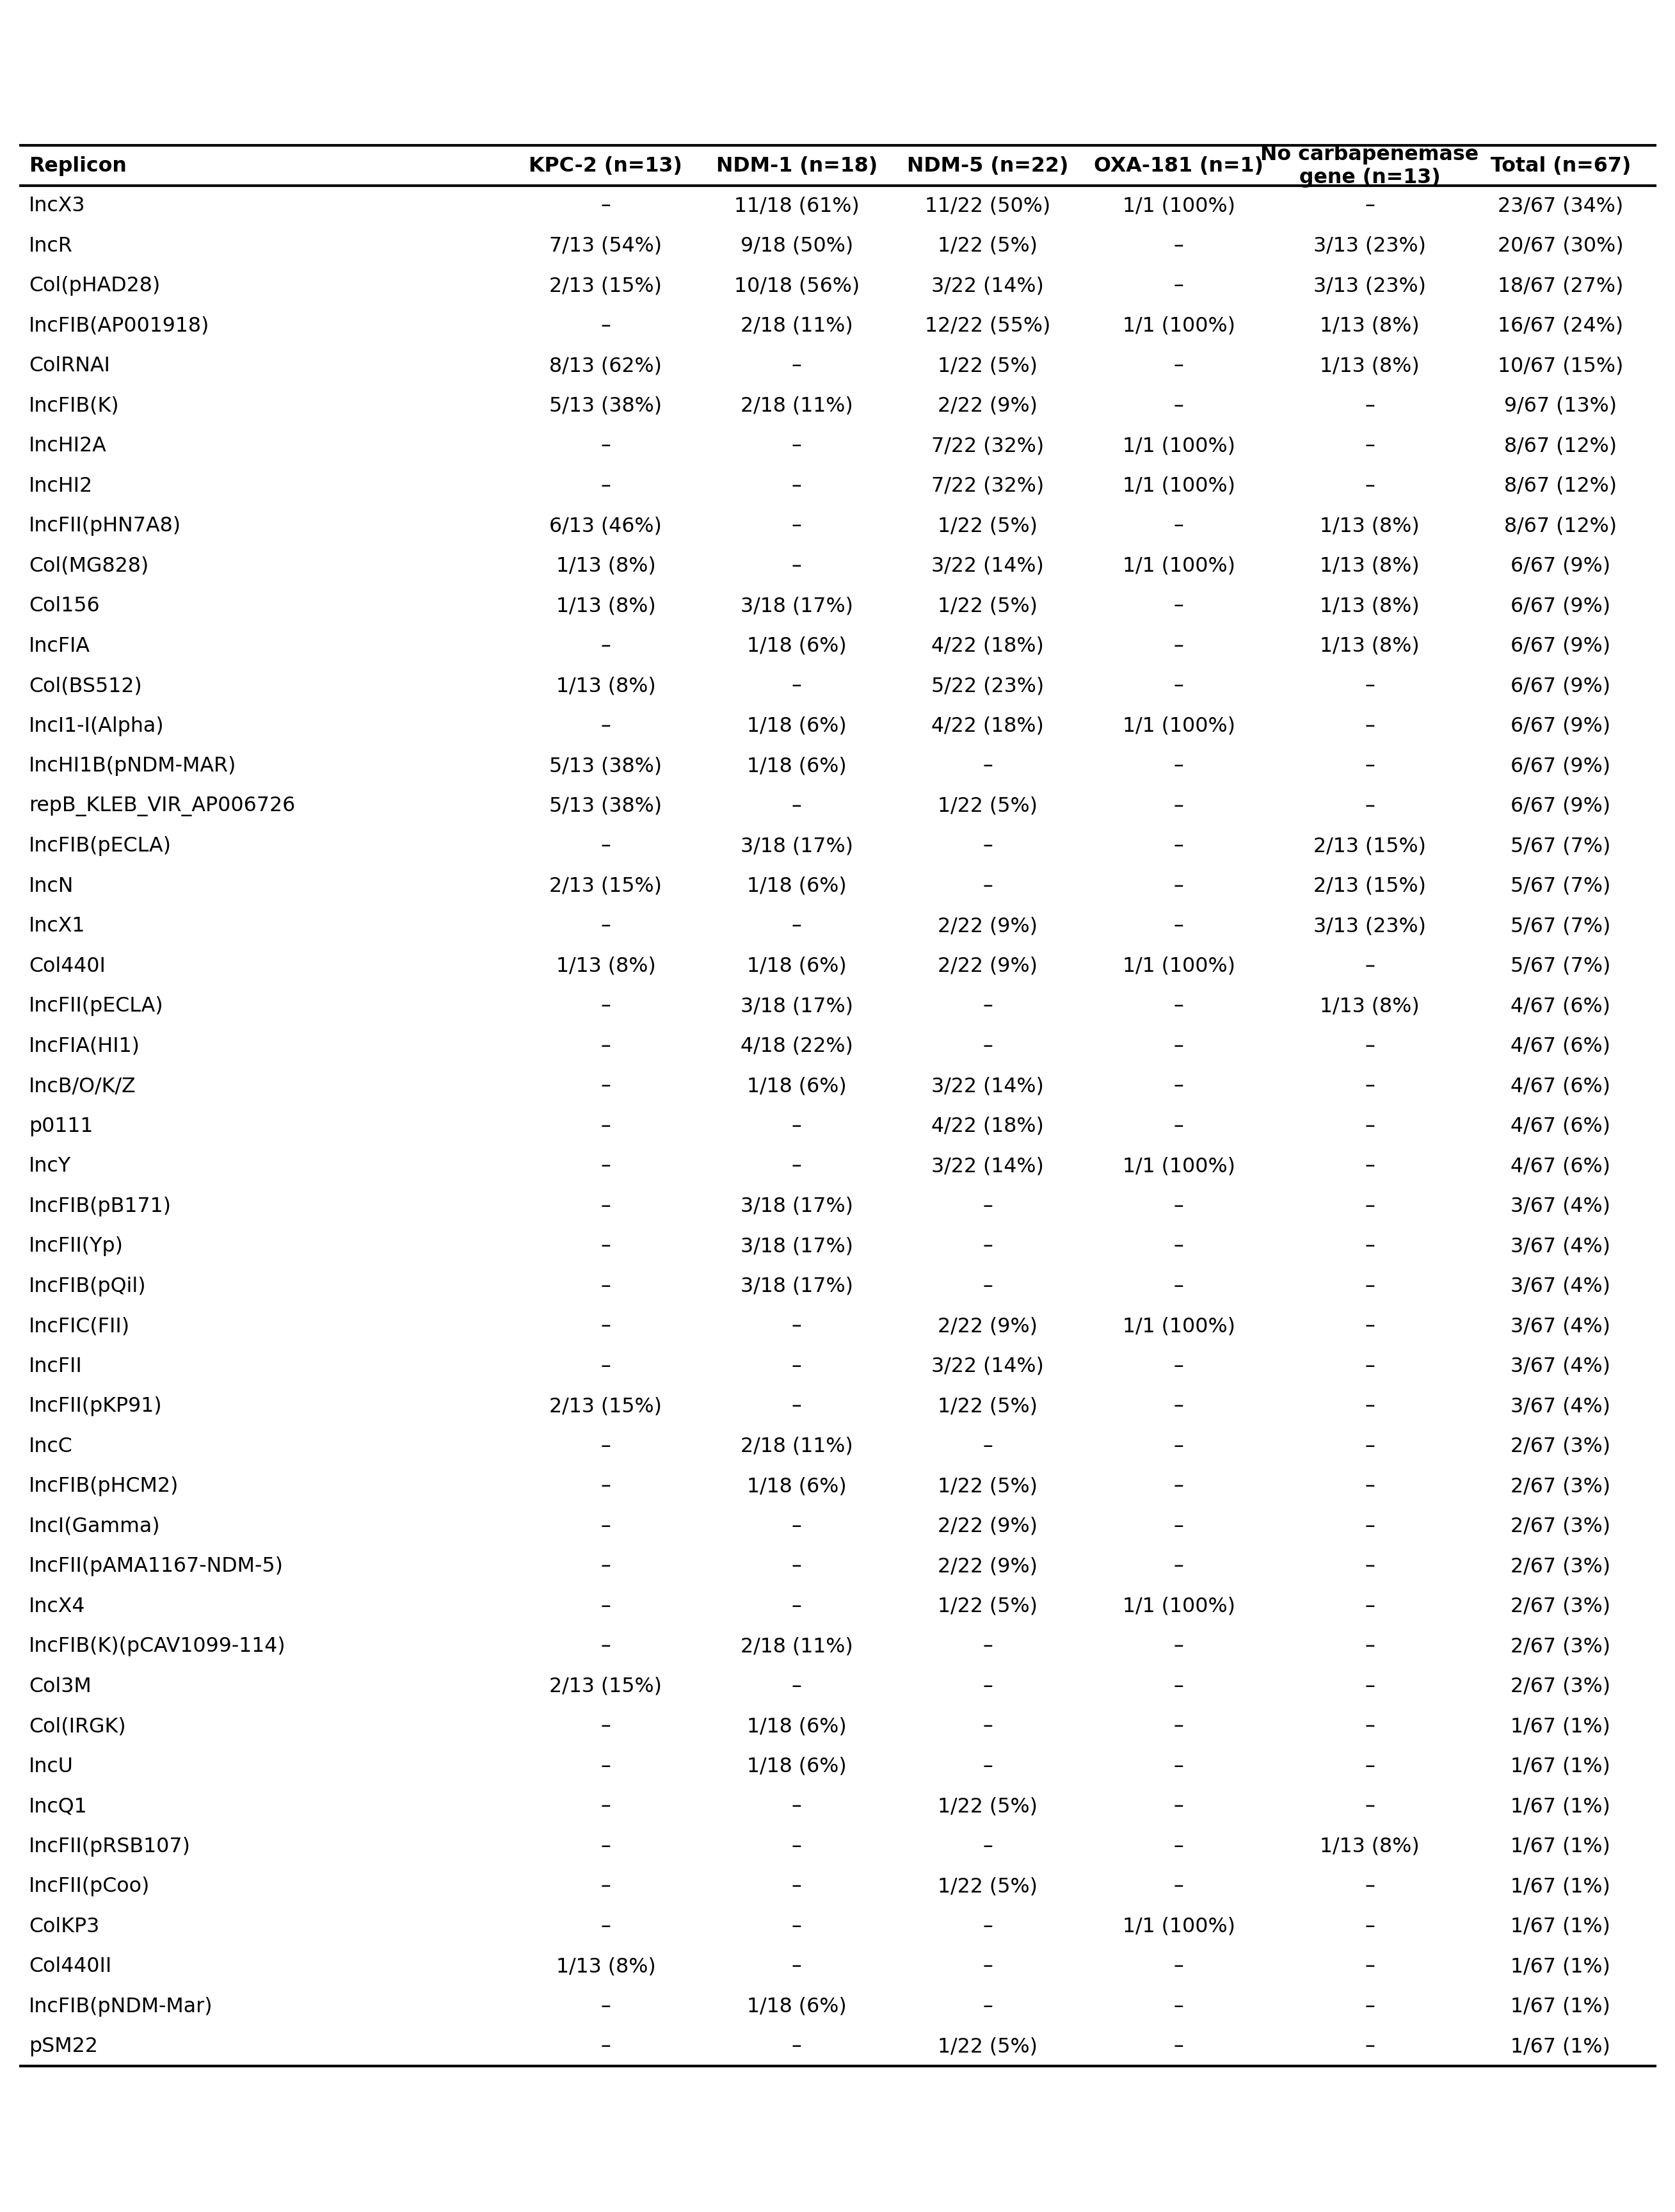
Table 10 · Plasmid replicons (= manuscript Supplemental Table S8) · Plasmid replicon carriage by carbapenemase group (Kleborate/PlasmidFinder, 47 rows).
Quick start (30 seconds, generic engine)
cd figure-generation/clinical-table
pip install pandas numpy scipy statsmodels
python scripts/clinical_table.py examples/input/clinical_cohorts.csv examples/output/clinical_tables.md
Expected anchors: CRE n=67, CSE n=72; Age 69.16±10.43 vs 63.18±12.56, p=0.003.
Quick start (R pipeline, full manuscript table suite)
Requires R with the logistf package (Table 2). Put the two pseudonymized CSVs and the Table-all.md skeleton in one folder and run in order:
cd examples/input/pipeline   # both CSVs and the Table-all.md skeleton live here
Rscript ../../scripts/pipeline/table1_baseline.R    # fills the Table 1 block of Table-all.md
Rscript ../../scripts/pipeline/table2_firth.R       # Firth regression
Rscript ../../scripts/pipeline/table3_esbl_genes.R  # then Tables 3–8 and 10 in order
python ../../scripts/pipeline/make_table9_sequencing_quality.py   # Table 9 writes a standalone CSV
Each script: read CSV → compute → fill its block in Table-all.md → write a standalone CSV. Full anchor list in examples/output/pipeline/REPORT.md.
Input format
- Generic engine: patient-level CSV (one row per patient): a two-level grouping column (default
cohort) + 0/1 binary columns + continuous columns; configure viaDEFAULT_CONFIGor--config your.json. - R pipeline: one CSV per cohort (column structure shown in examples/input/pipeline/); the bundled example IS the pseudonymized real data — prepare your own data with the same column layout.
Output files
| File | Content |
|---|---|
clinical_tables.md (generic engine) | baseline / correlation / Cox / OR three-line tables |
Table-all.md (R pipeline) | the complete filled manuscript table set (224 lines) |
table1_baseline.csv … table10_plasmid_replicons.csv | standalone CSV per table (Table 9 = table9_sequencing_quality.csv) |
Troubleshooting
- p values differ from SPSS → this skill uses Pearson χ² WITHOUT continuity correction (publication Table-1 convention).
- R scripts crash on Windows → keep comments ASCII/English (the bundled scripts already are); if you edit comments yourself, save as UTF-8 without BOM or run
Rscript --encoding=utf-8. - logistf missing →
install.packages("logistf"). - Continuous variable missing from the baseline table → add it to
baseline_continuous_varsinDEFAULT_CONFIG. - Cox table absent → only appears when both
survival_timeandsurvival_eventcolumns exist.
Links
- Source & SKILL.md on GitHub
- Related skills: Kaplan-Meier curve