
Claw2BioLab-validated AI agent skills for biomedical analysis
No coding required · Fixed scripts validated in real lab work · Your data never leaves your machine
No coding required · Fixed scripts validated in real lab work · Your data never leaves your machine
qPCR and more — turn raw instrument output into statistics and figures. Every image below is a REAL example output of the skill.
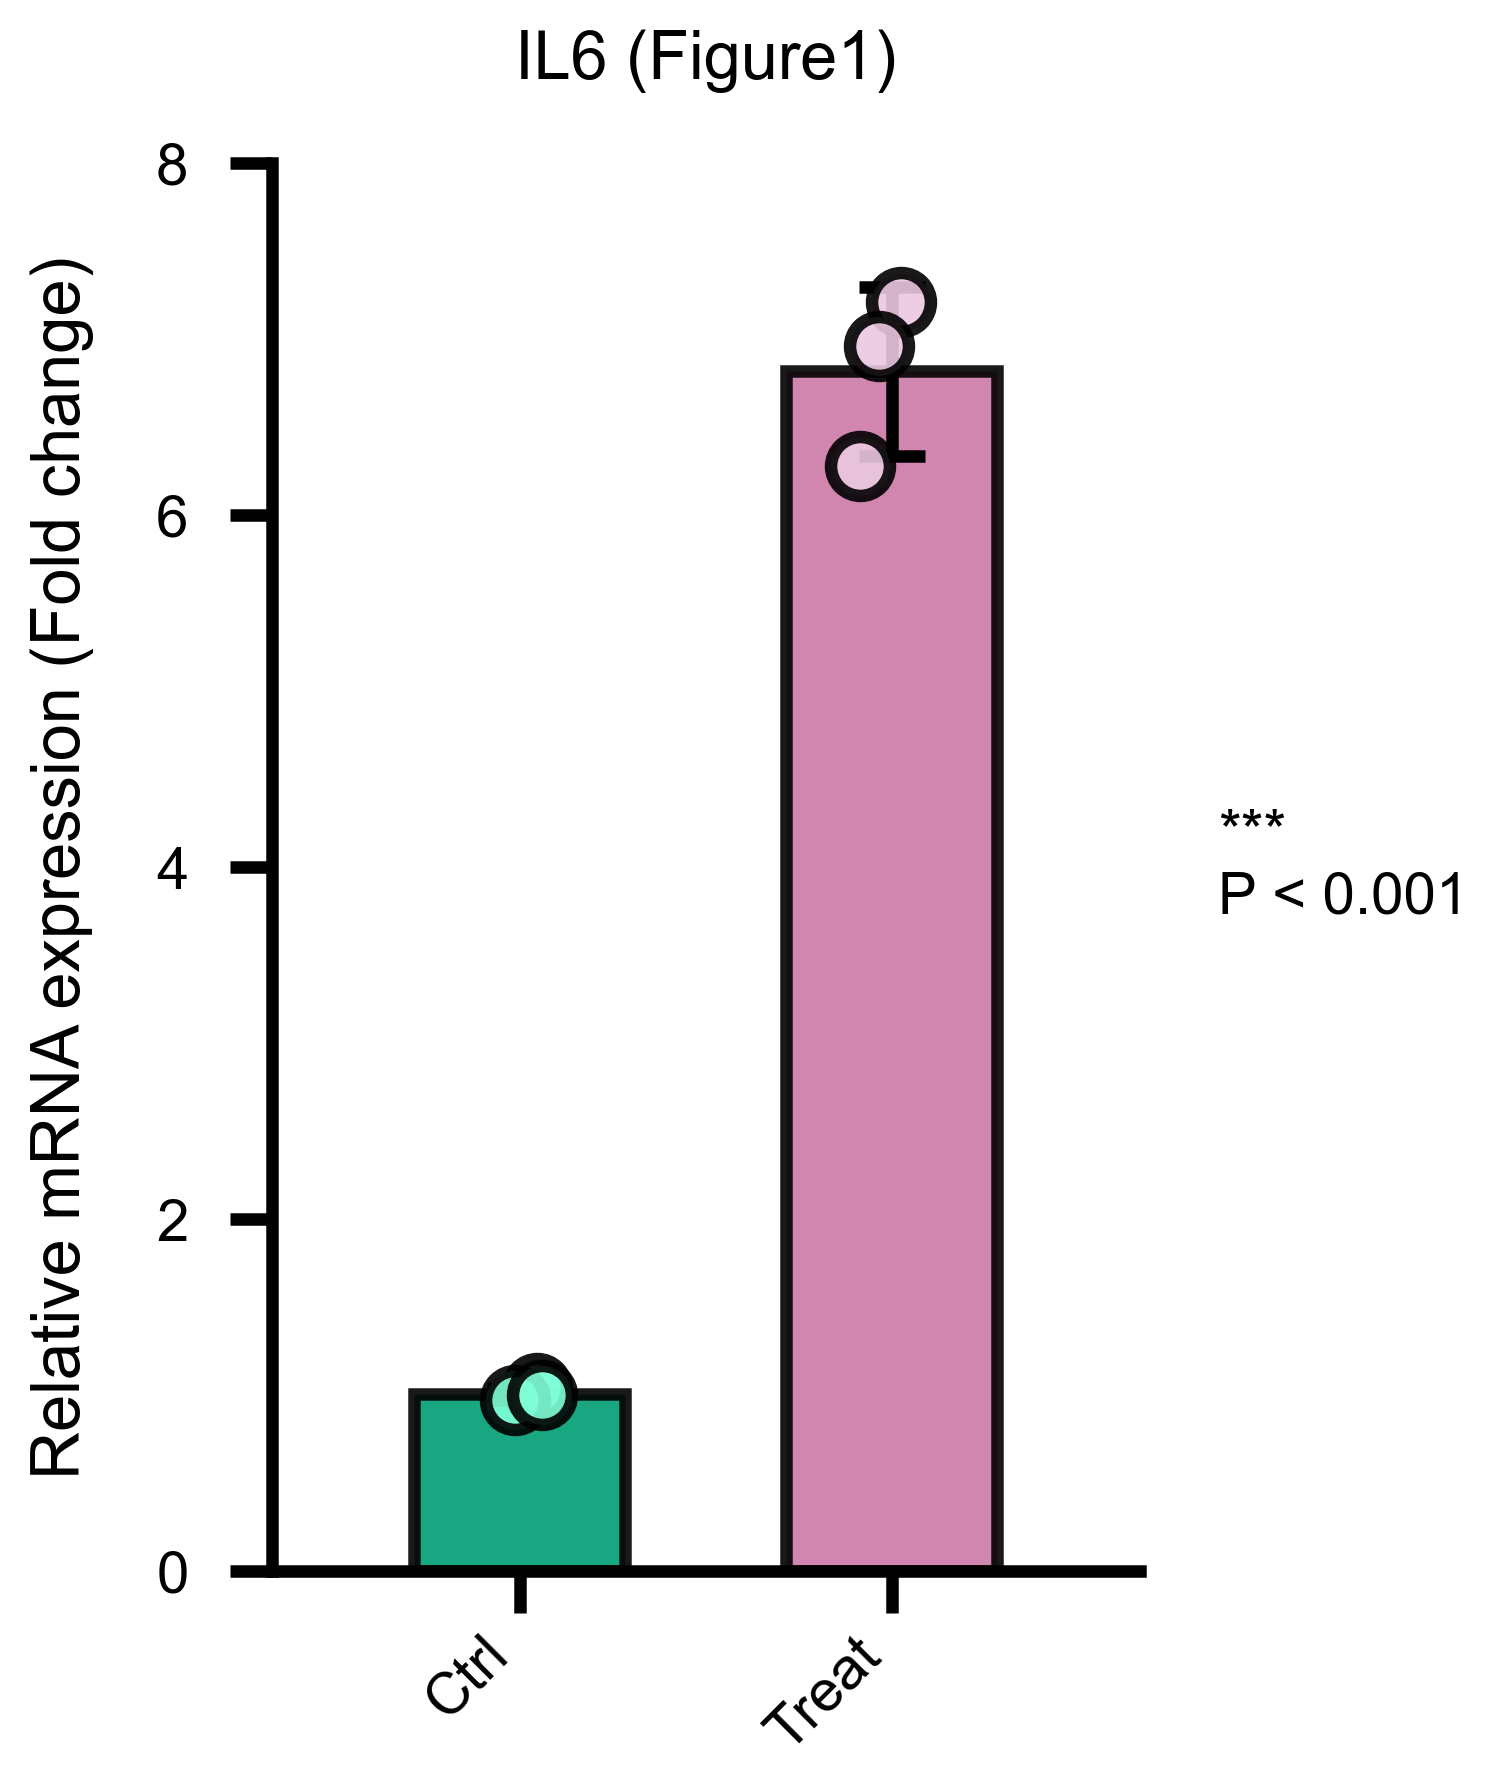
qPCR mRNA (ΔΔCt)
ΔΔCt relative expression with t-test / ANOVA + Dunnett, one bar plot per target.
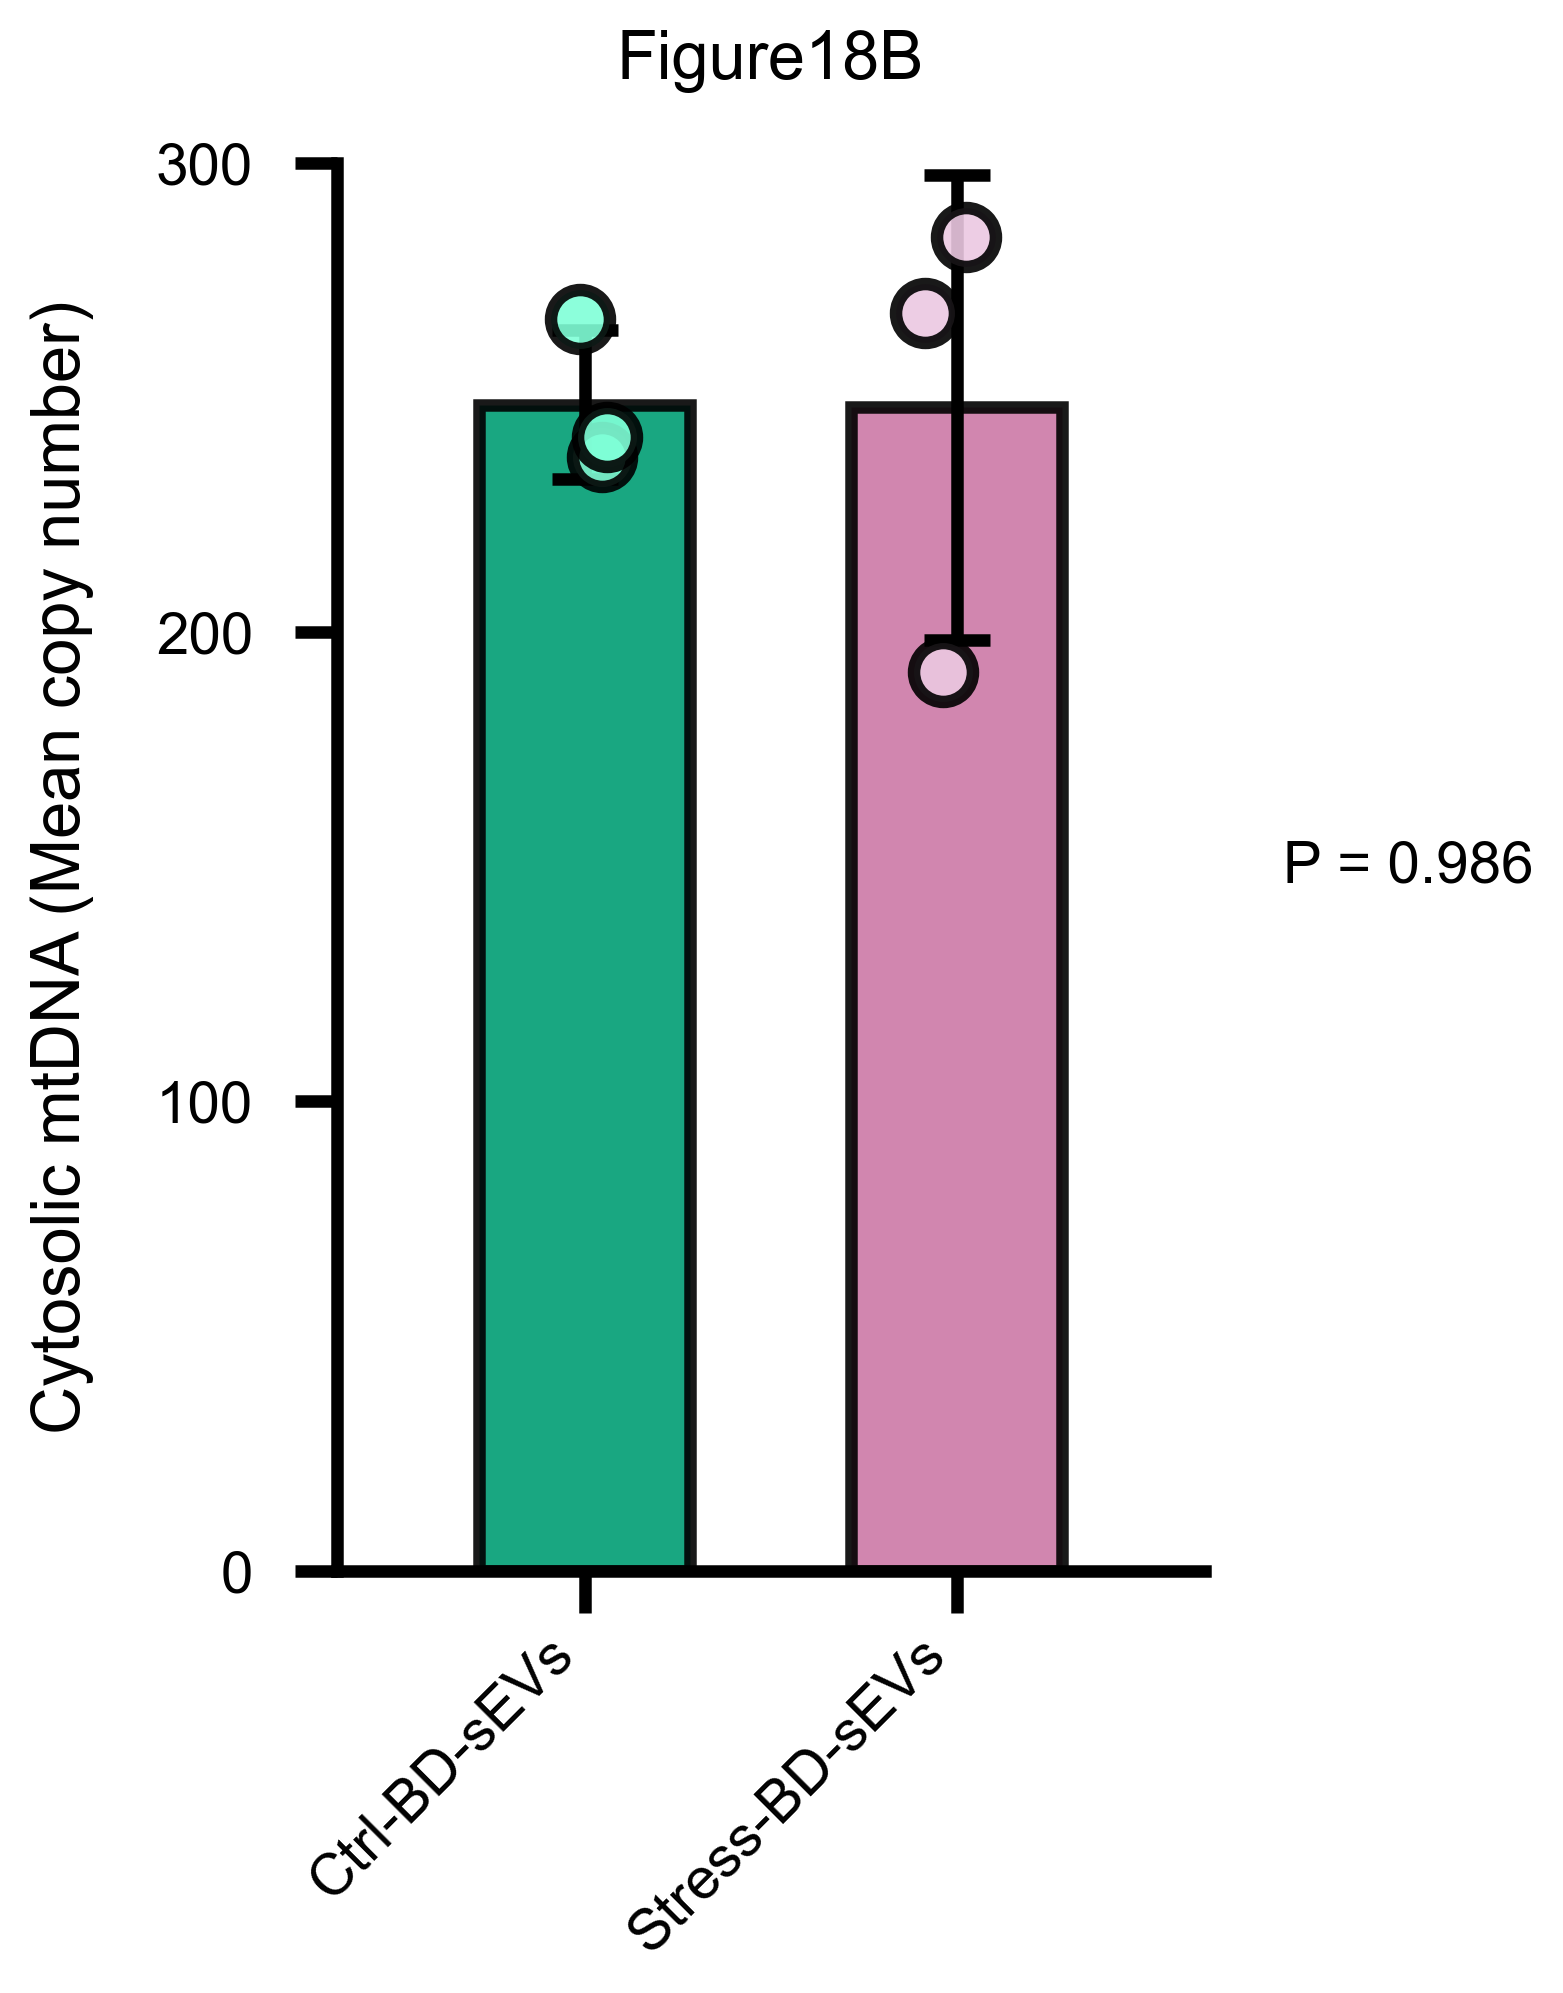
qPCR mtDNA Copy Number
ND1/ND5/B2M/POLG pairing, mean copy number, publication-ready plot.
Single-cell, bulk RNA-seq, phylogenetics — every card is a real figure produced by the linked skill.
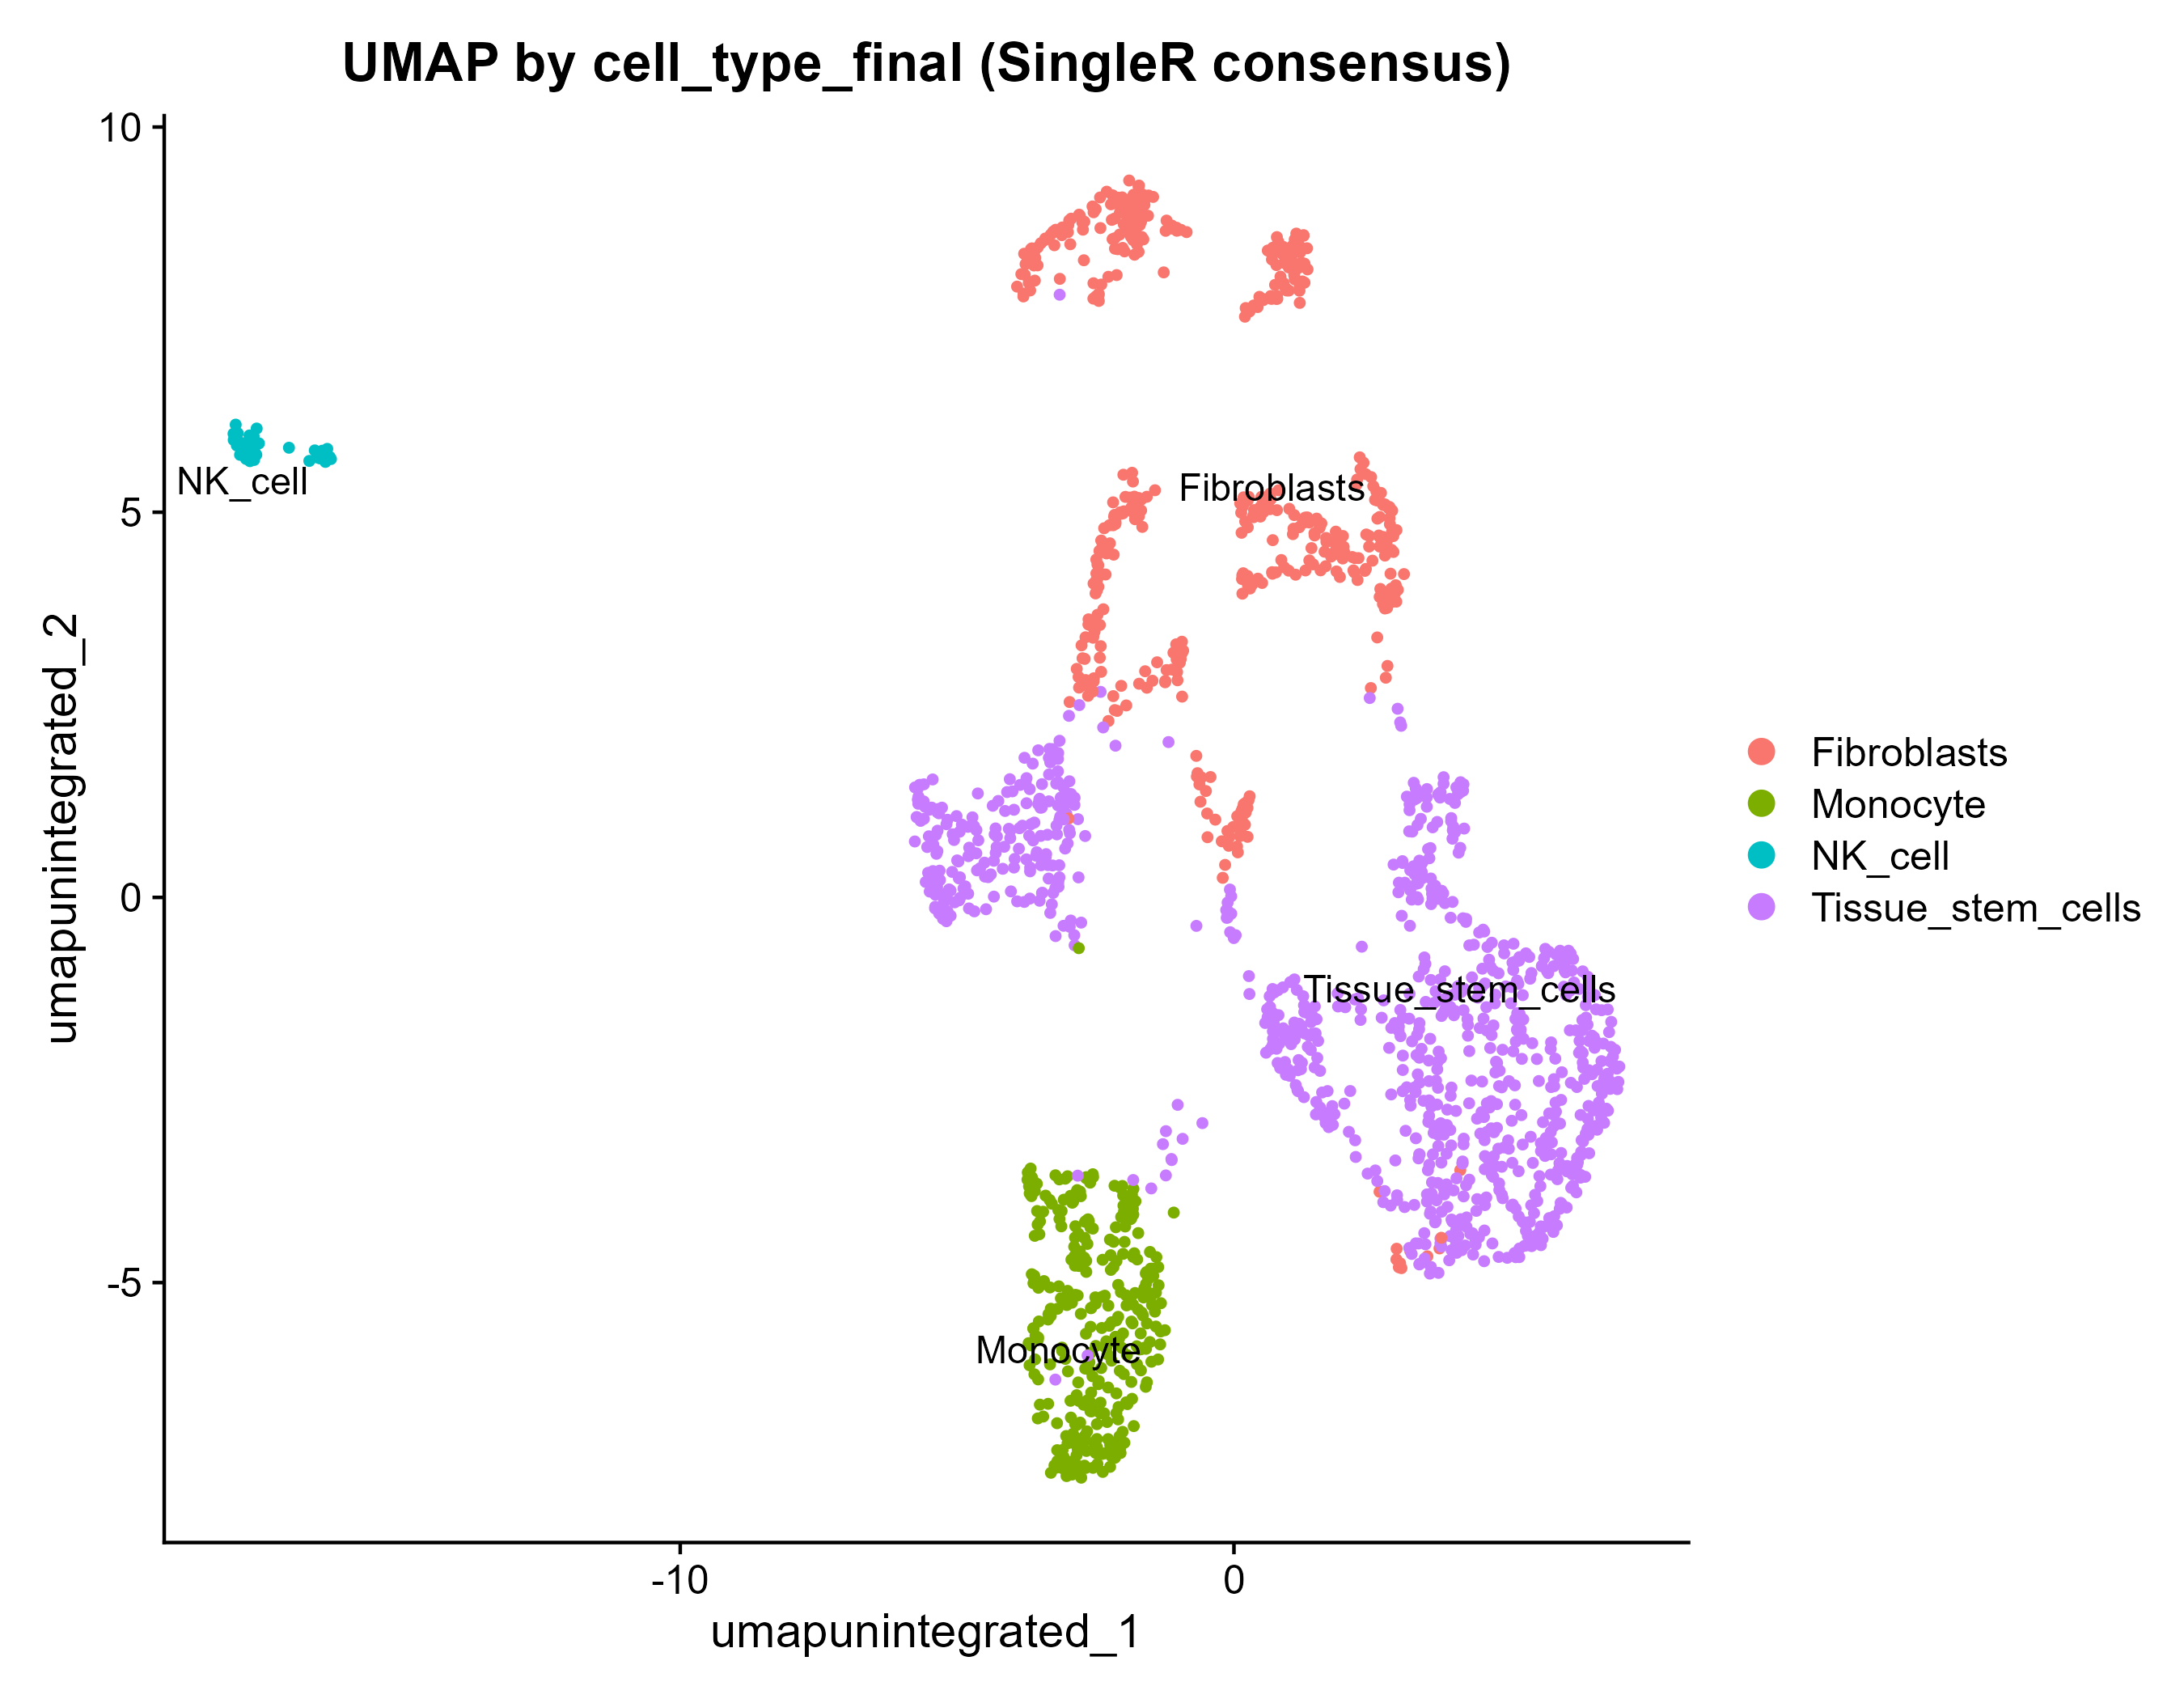
Annotated UMAP
scRNA-seq · raw matrix → QC → Harmony → clusters → SingleR cell types.
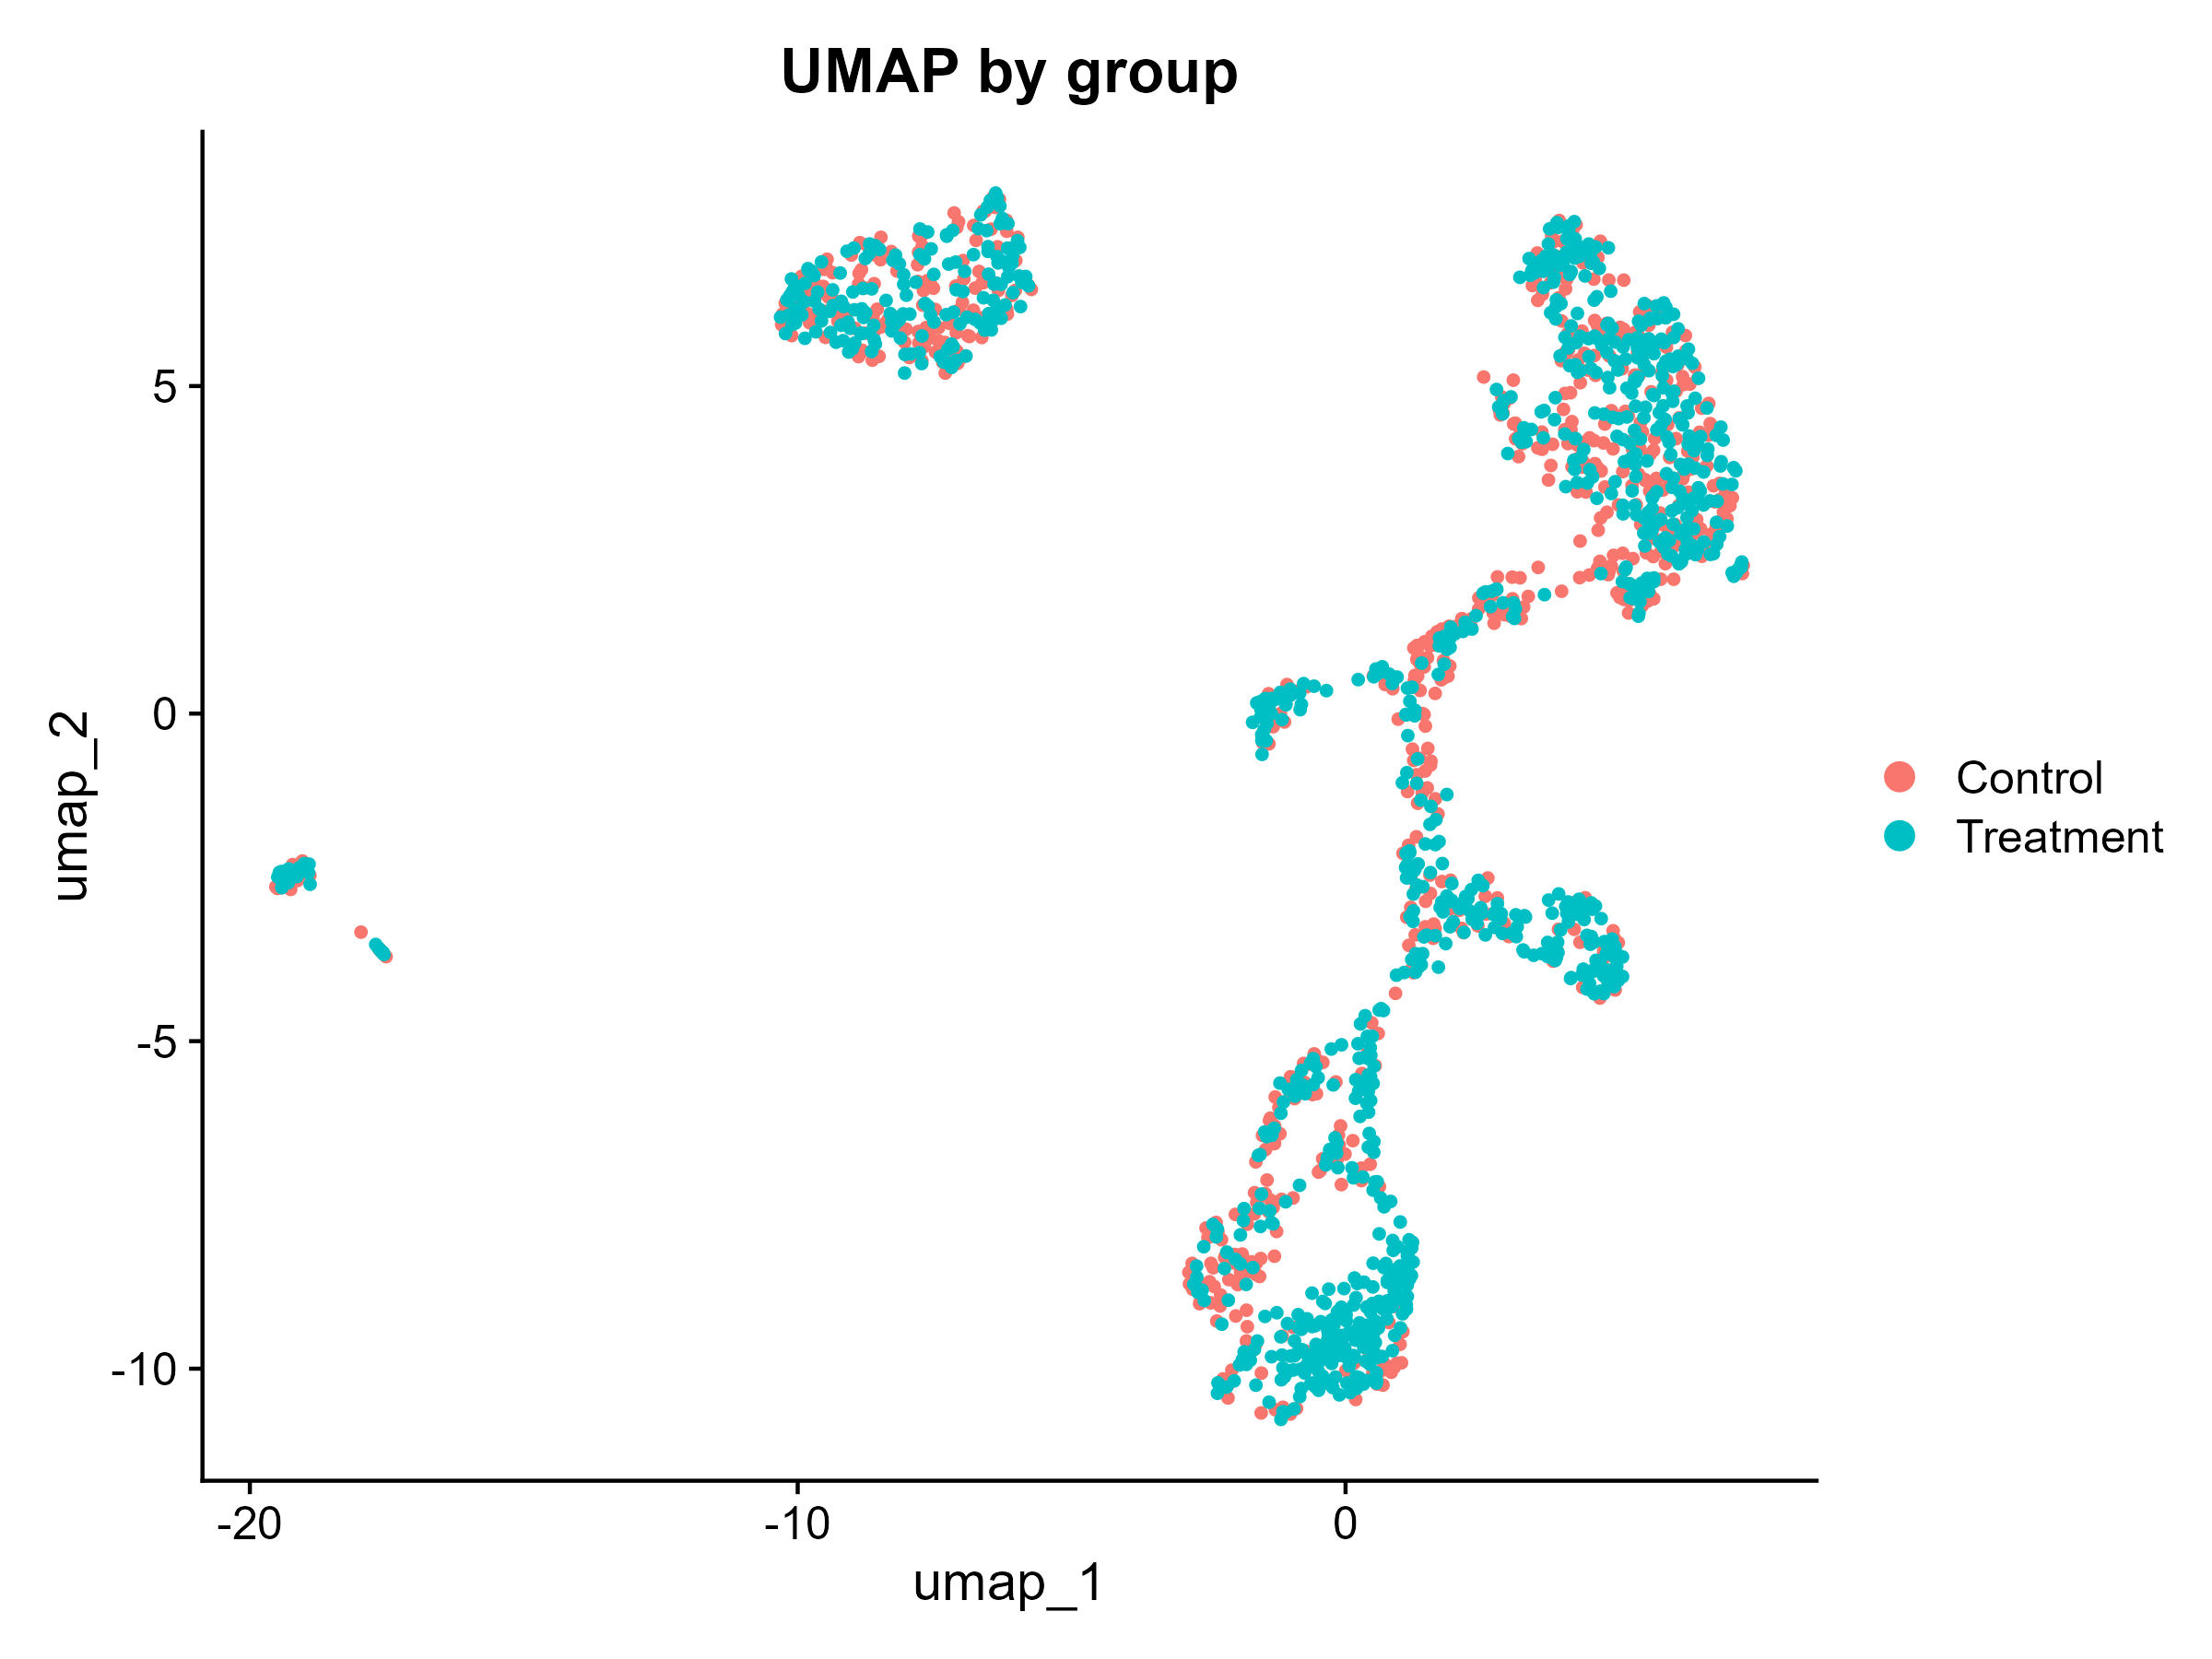
UMAP by Group
scRNA-seq · group-split embedding after batch integration.
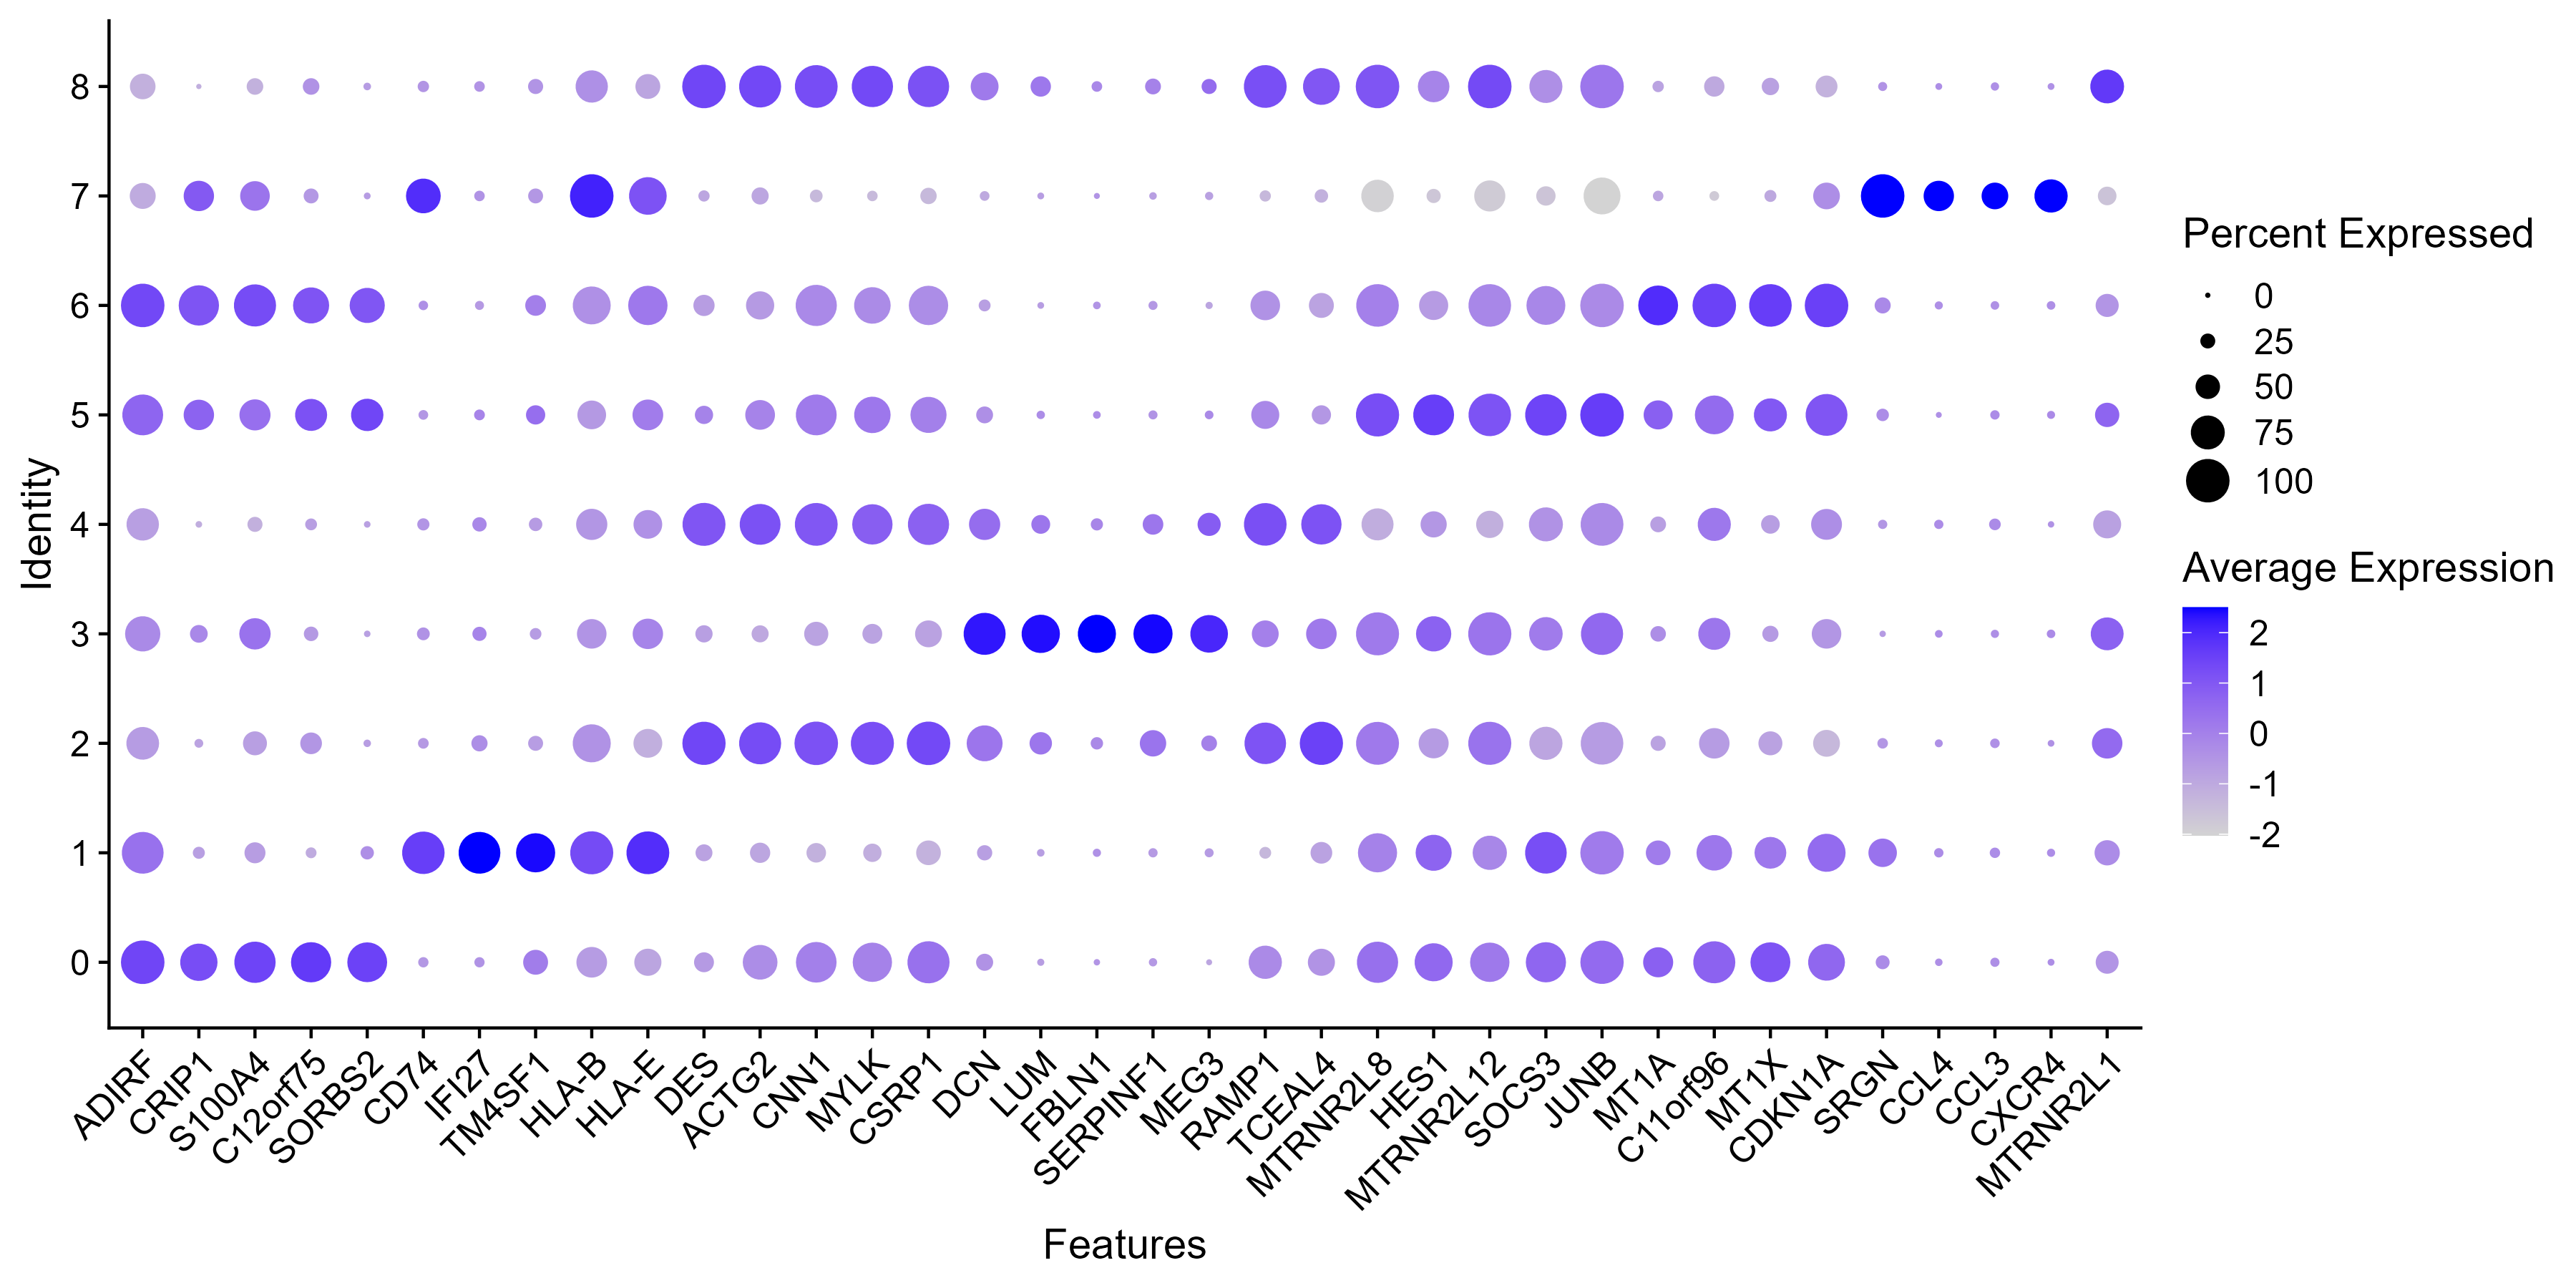
Marker Dotplot
scRNA-seq · per-cluster marker genes, expression × percent.
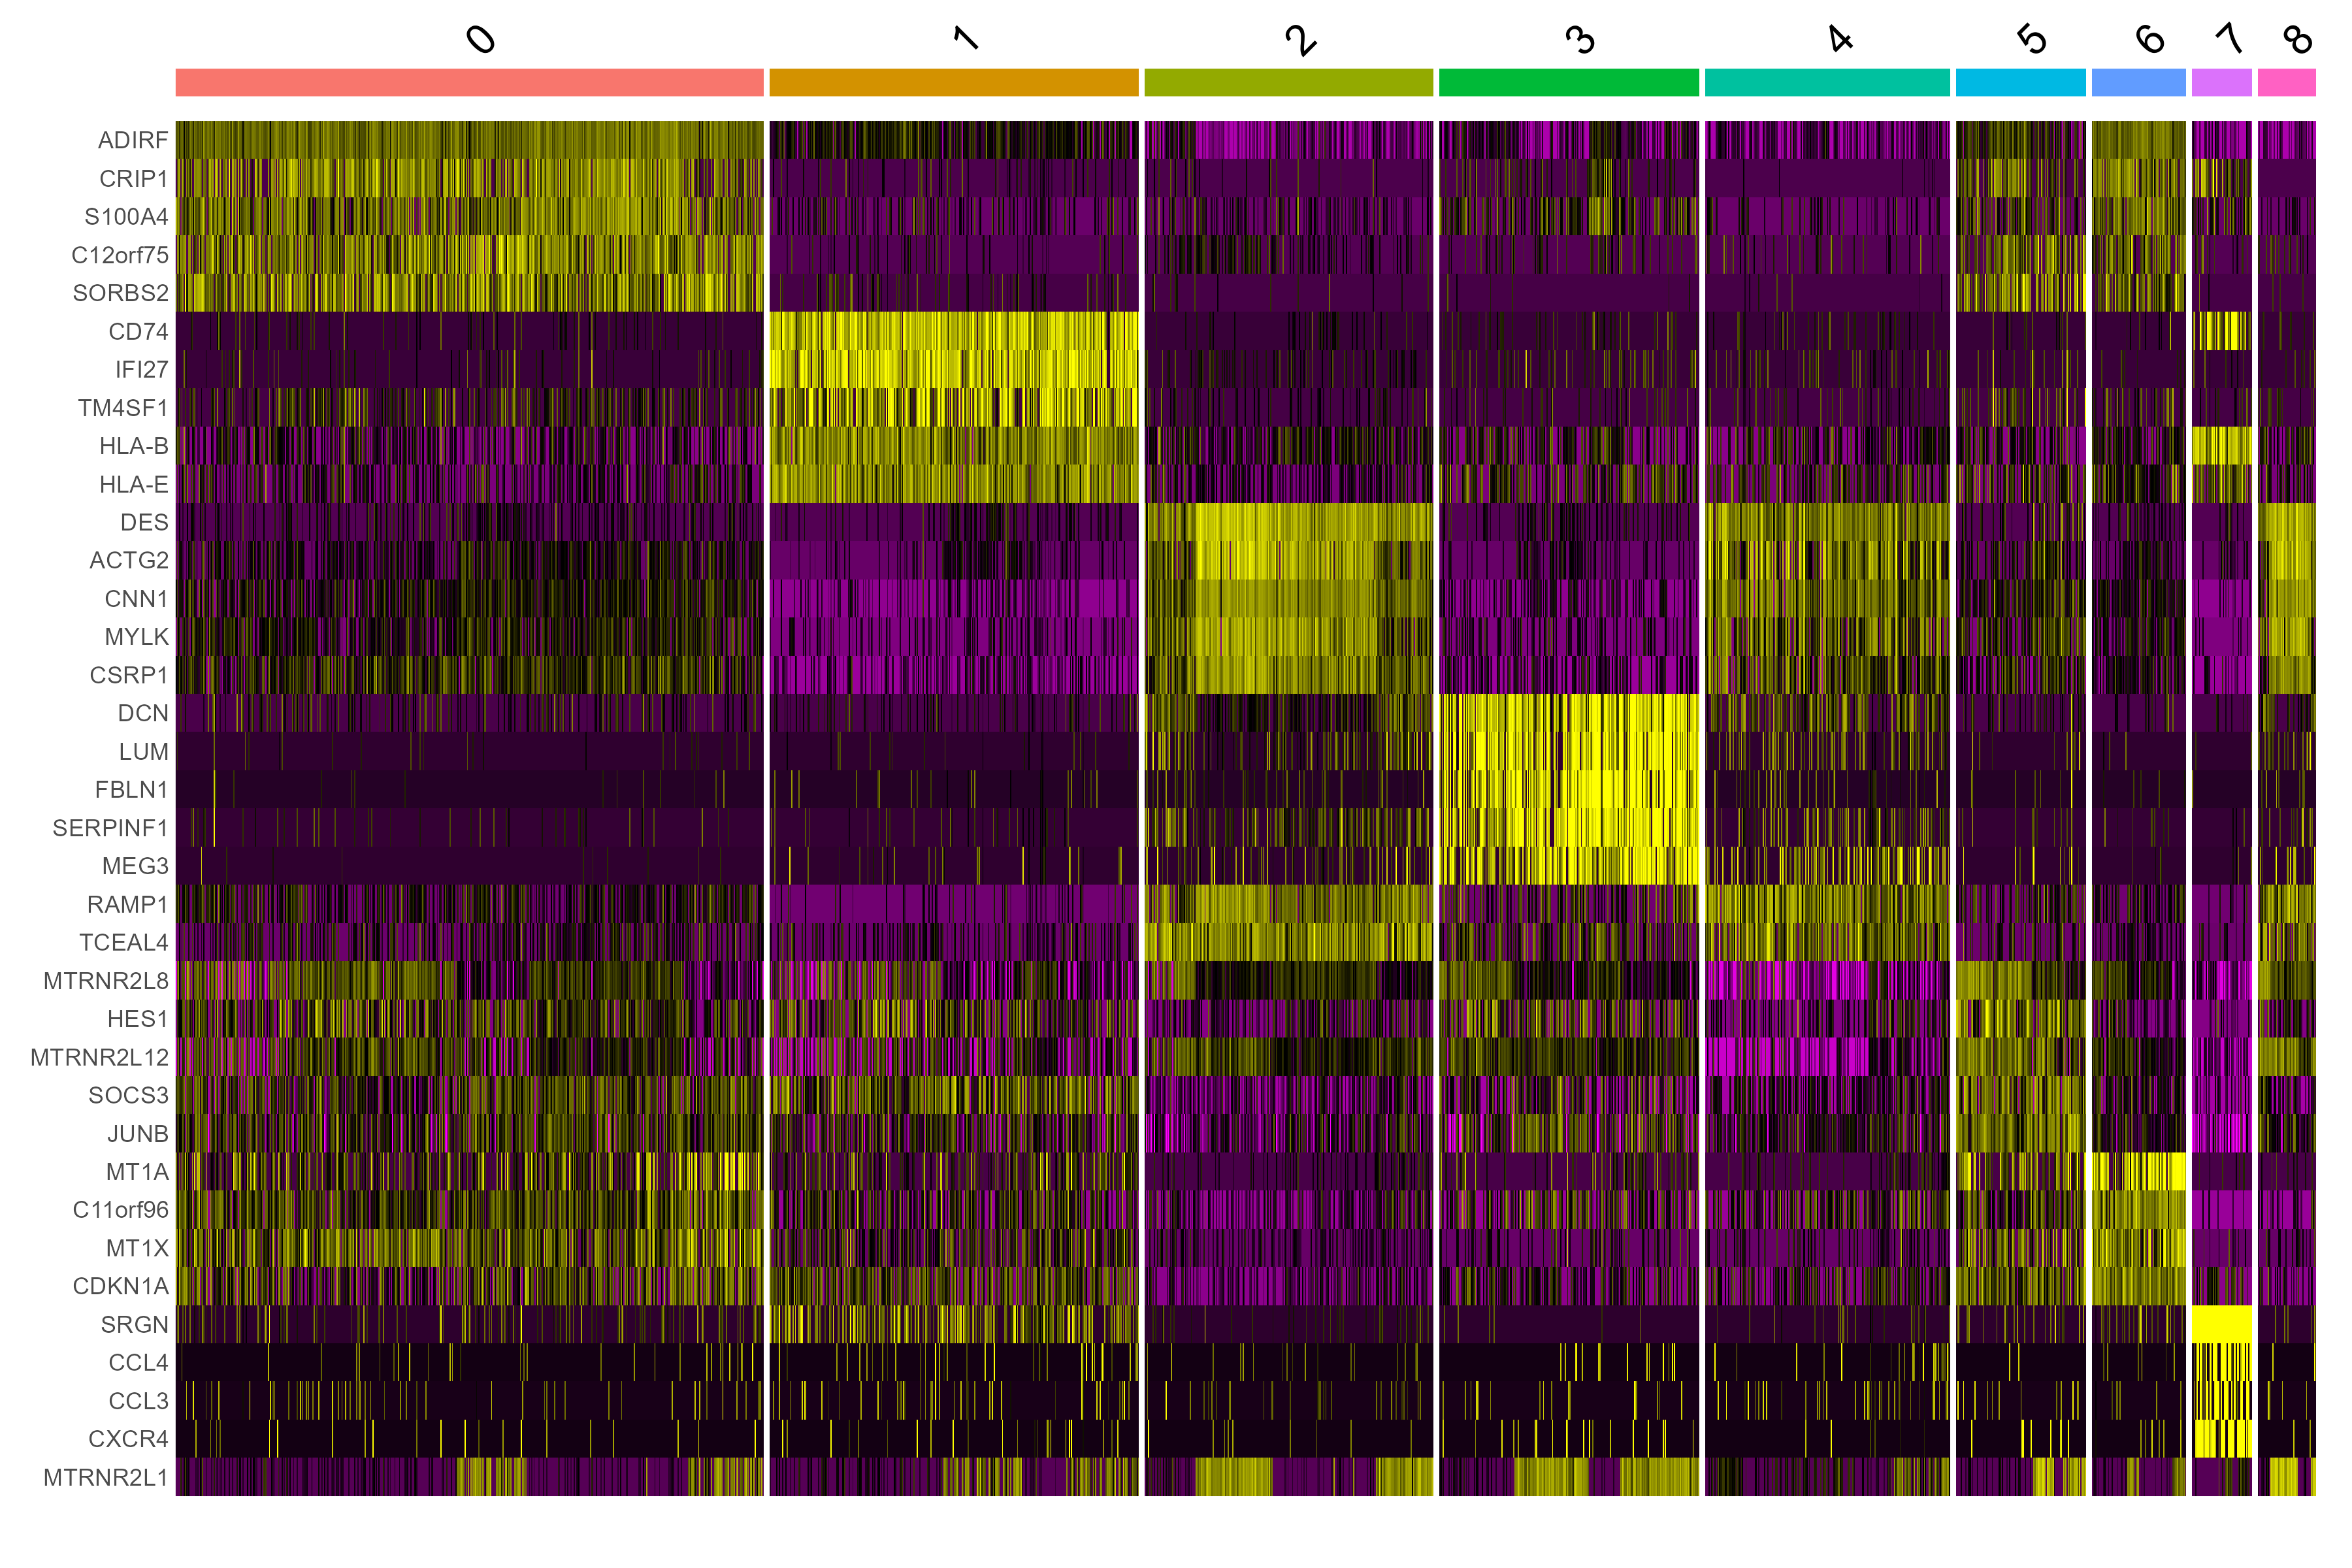
Marker Heatmap
scRNA-seq · top markers per cluster at a glance.
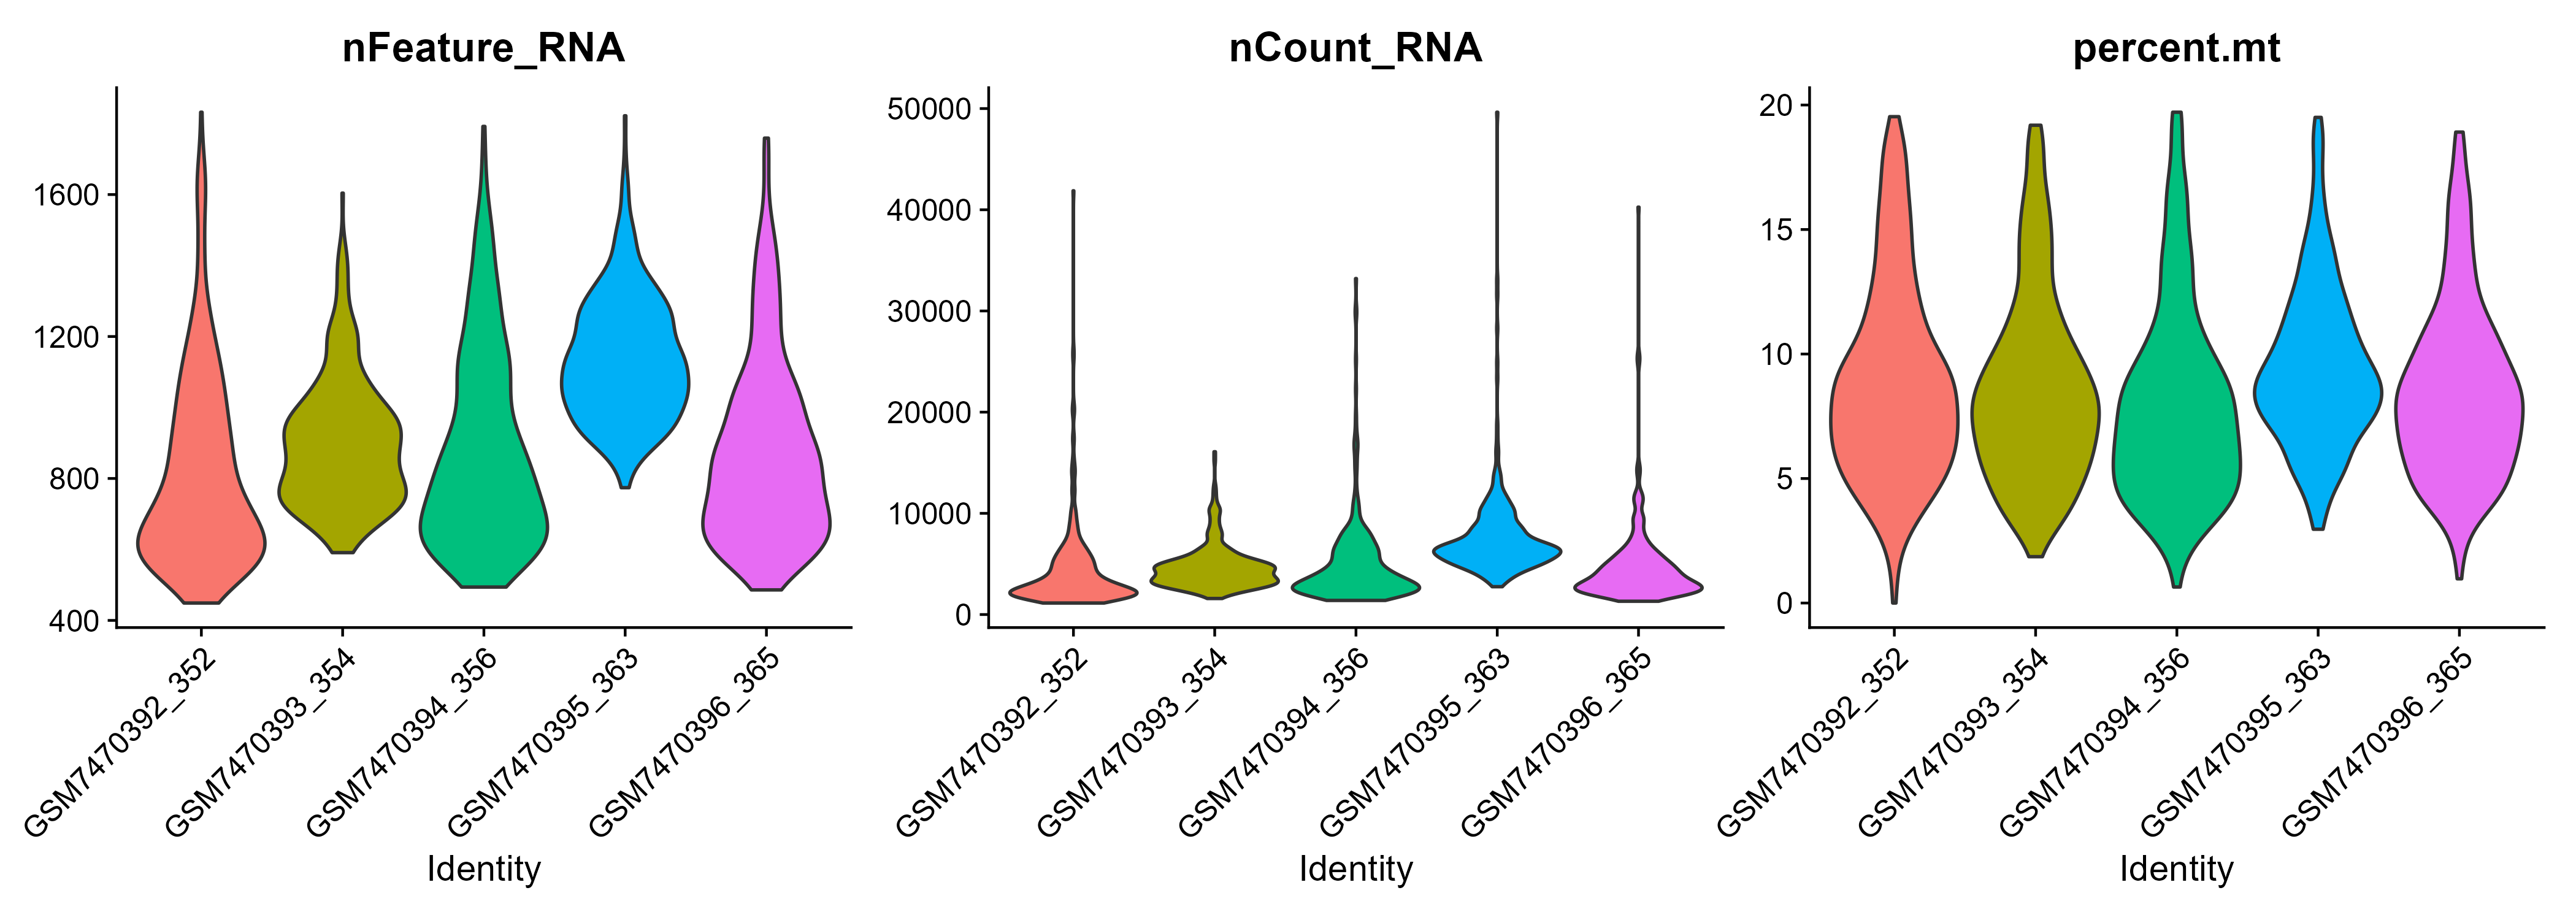
QC Violin
scRNA-seq · nFeature / nCount / percent.mt before-after filtering.
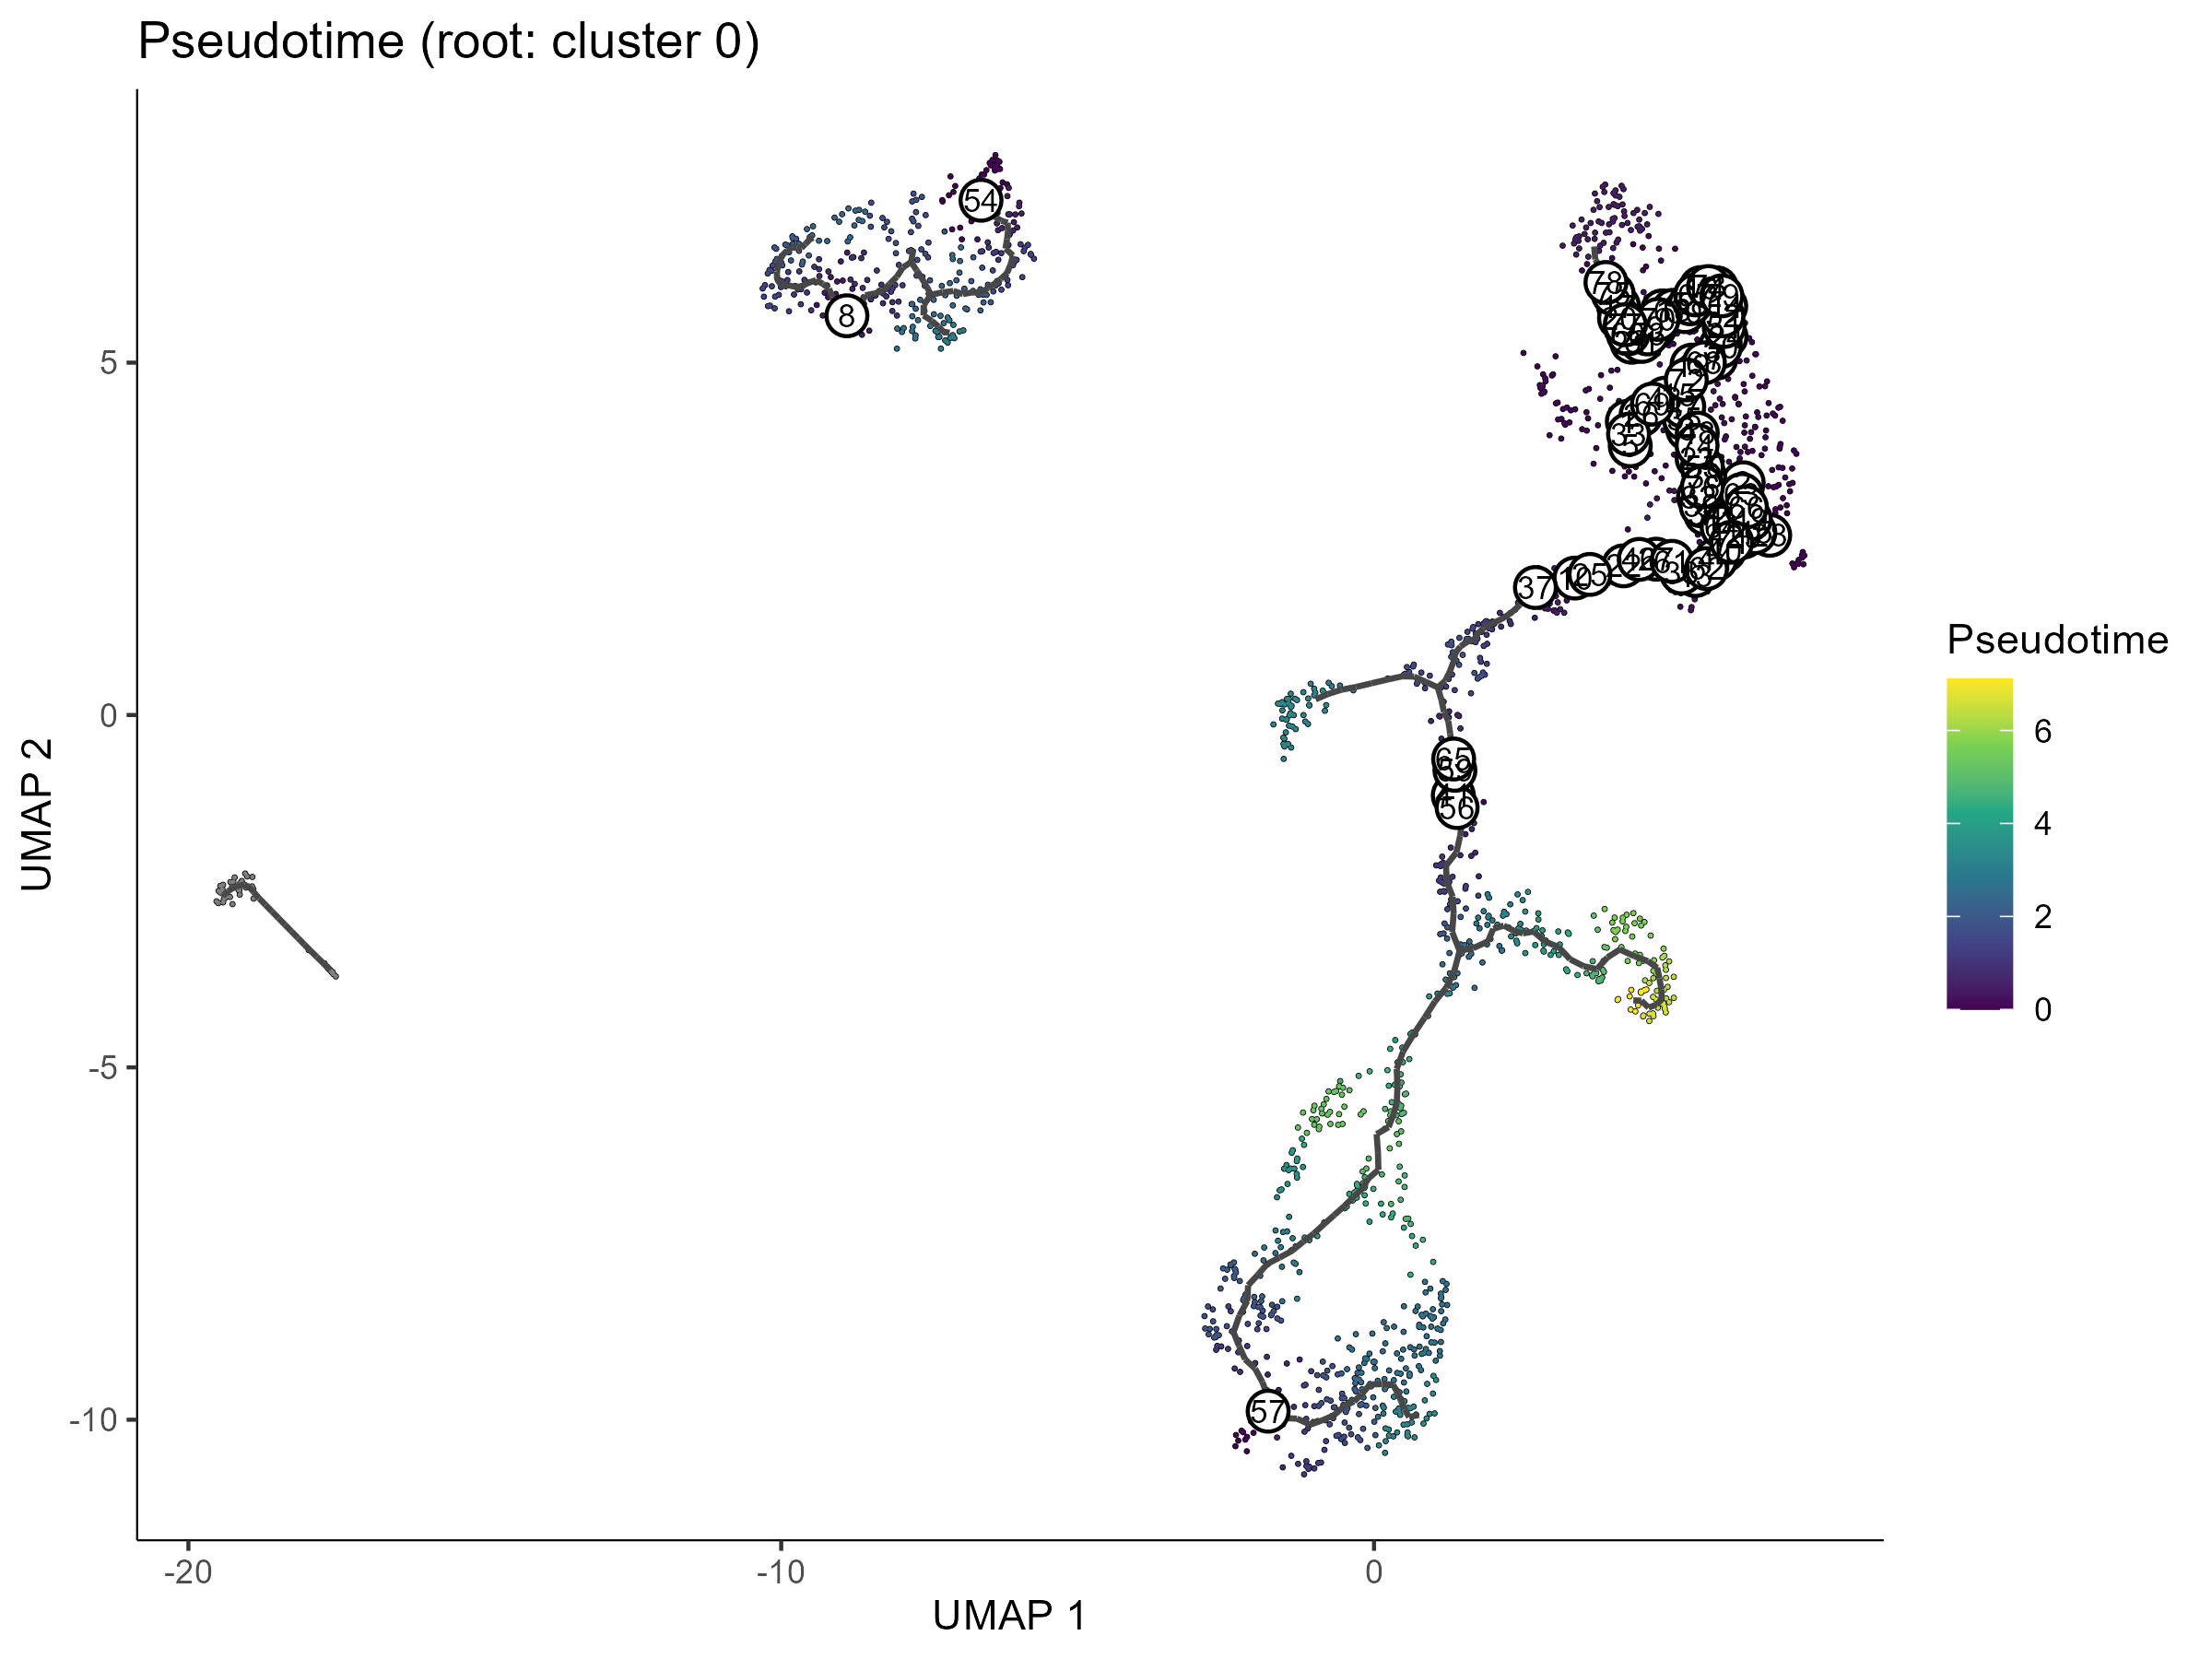
Pseudotime Trajectory
scRNA-seq-pseudotime · monocle3 trajectory on your annotated rds.
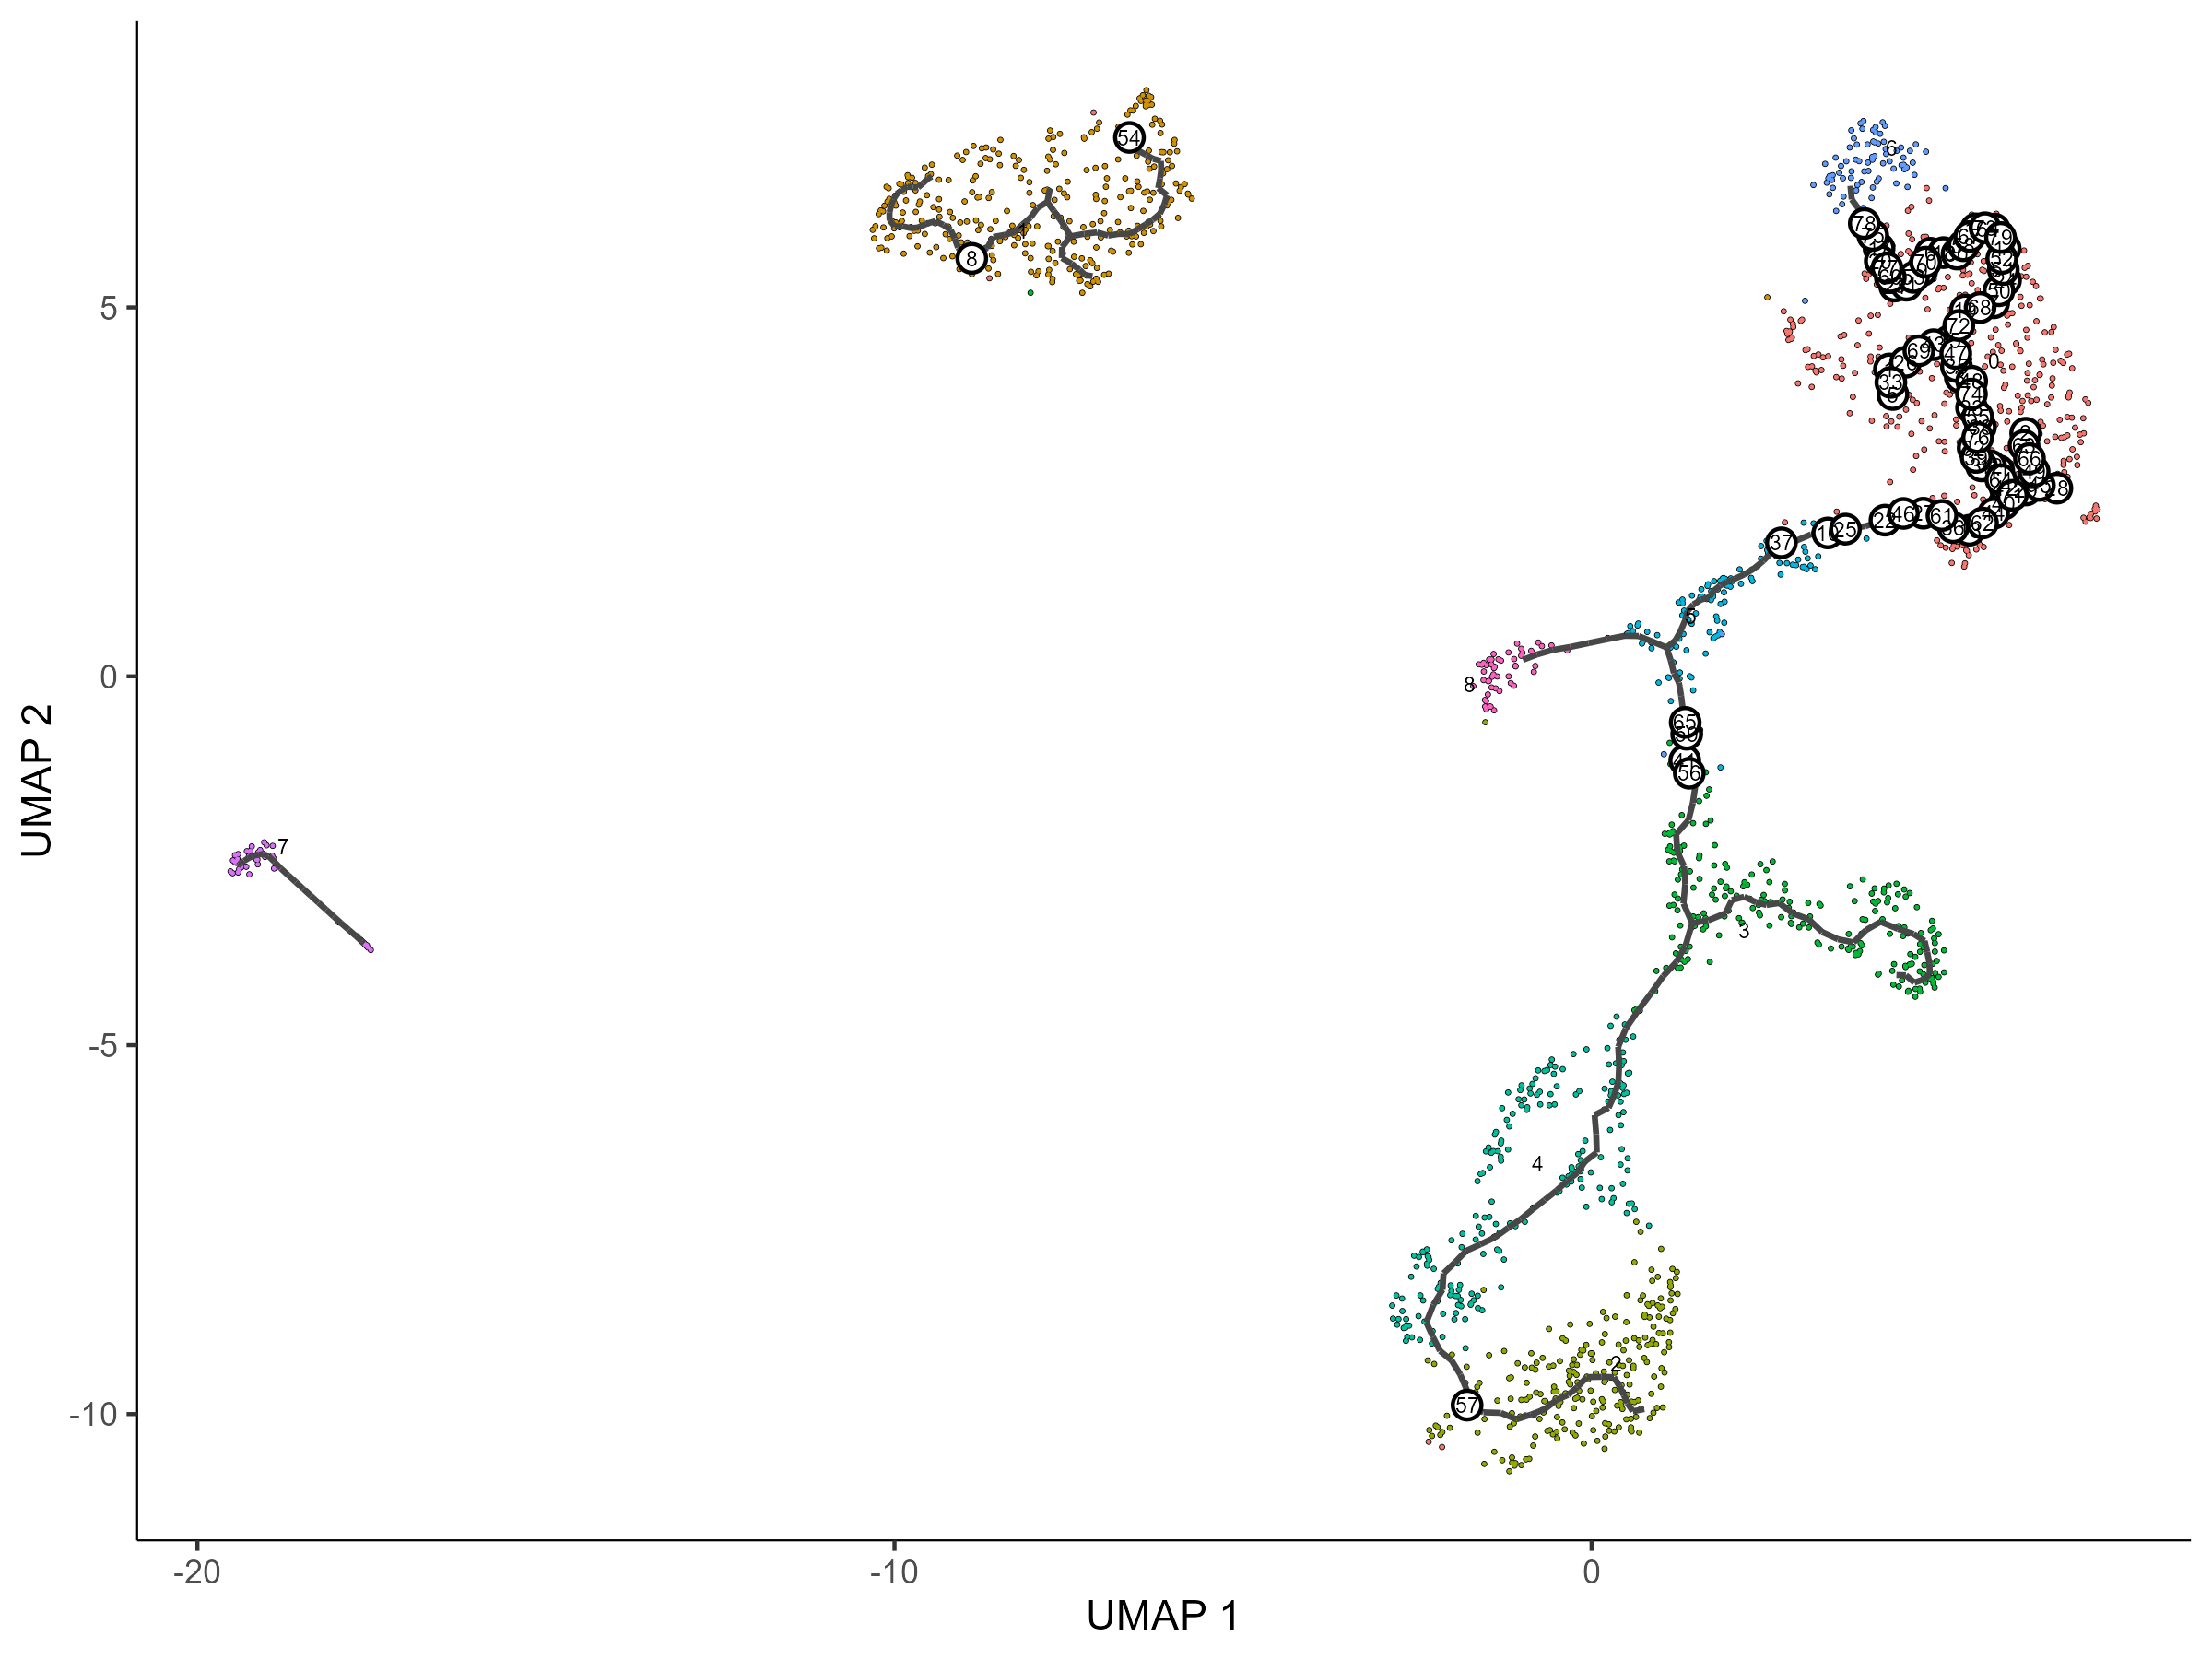
Trajectory by Cluster
scRNA-seq-pseudotime · clusters mapped onto the learned tree.
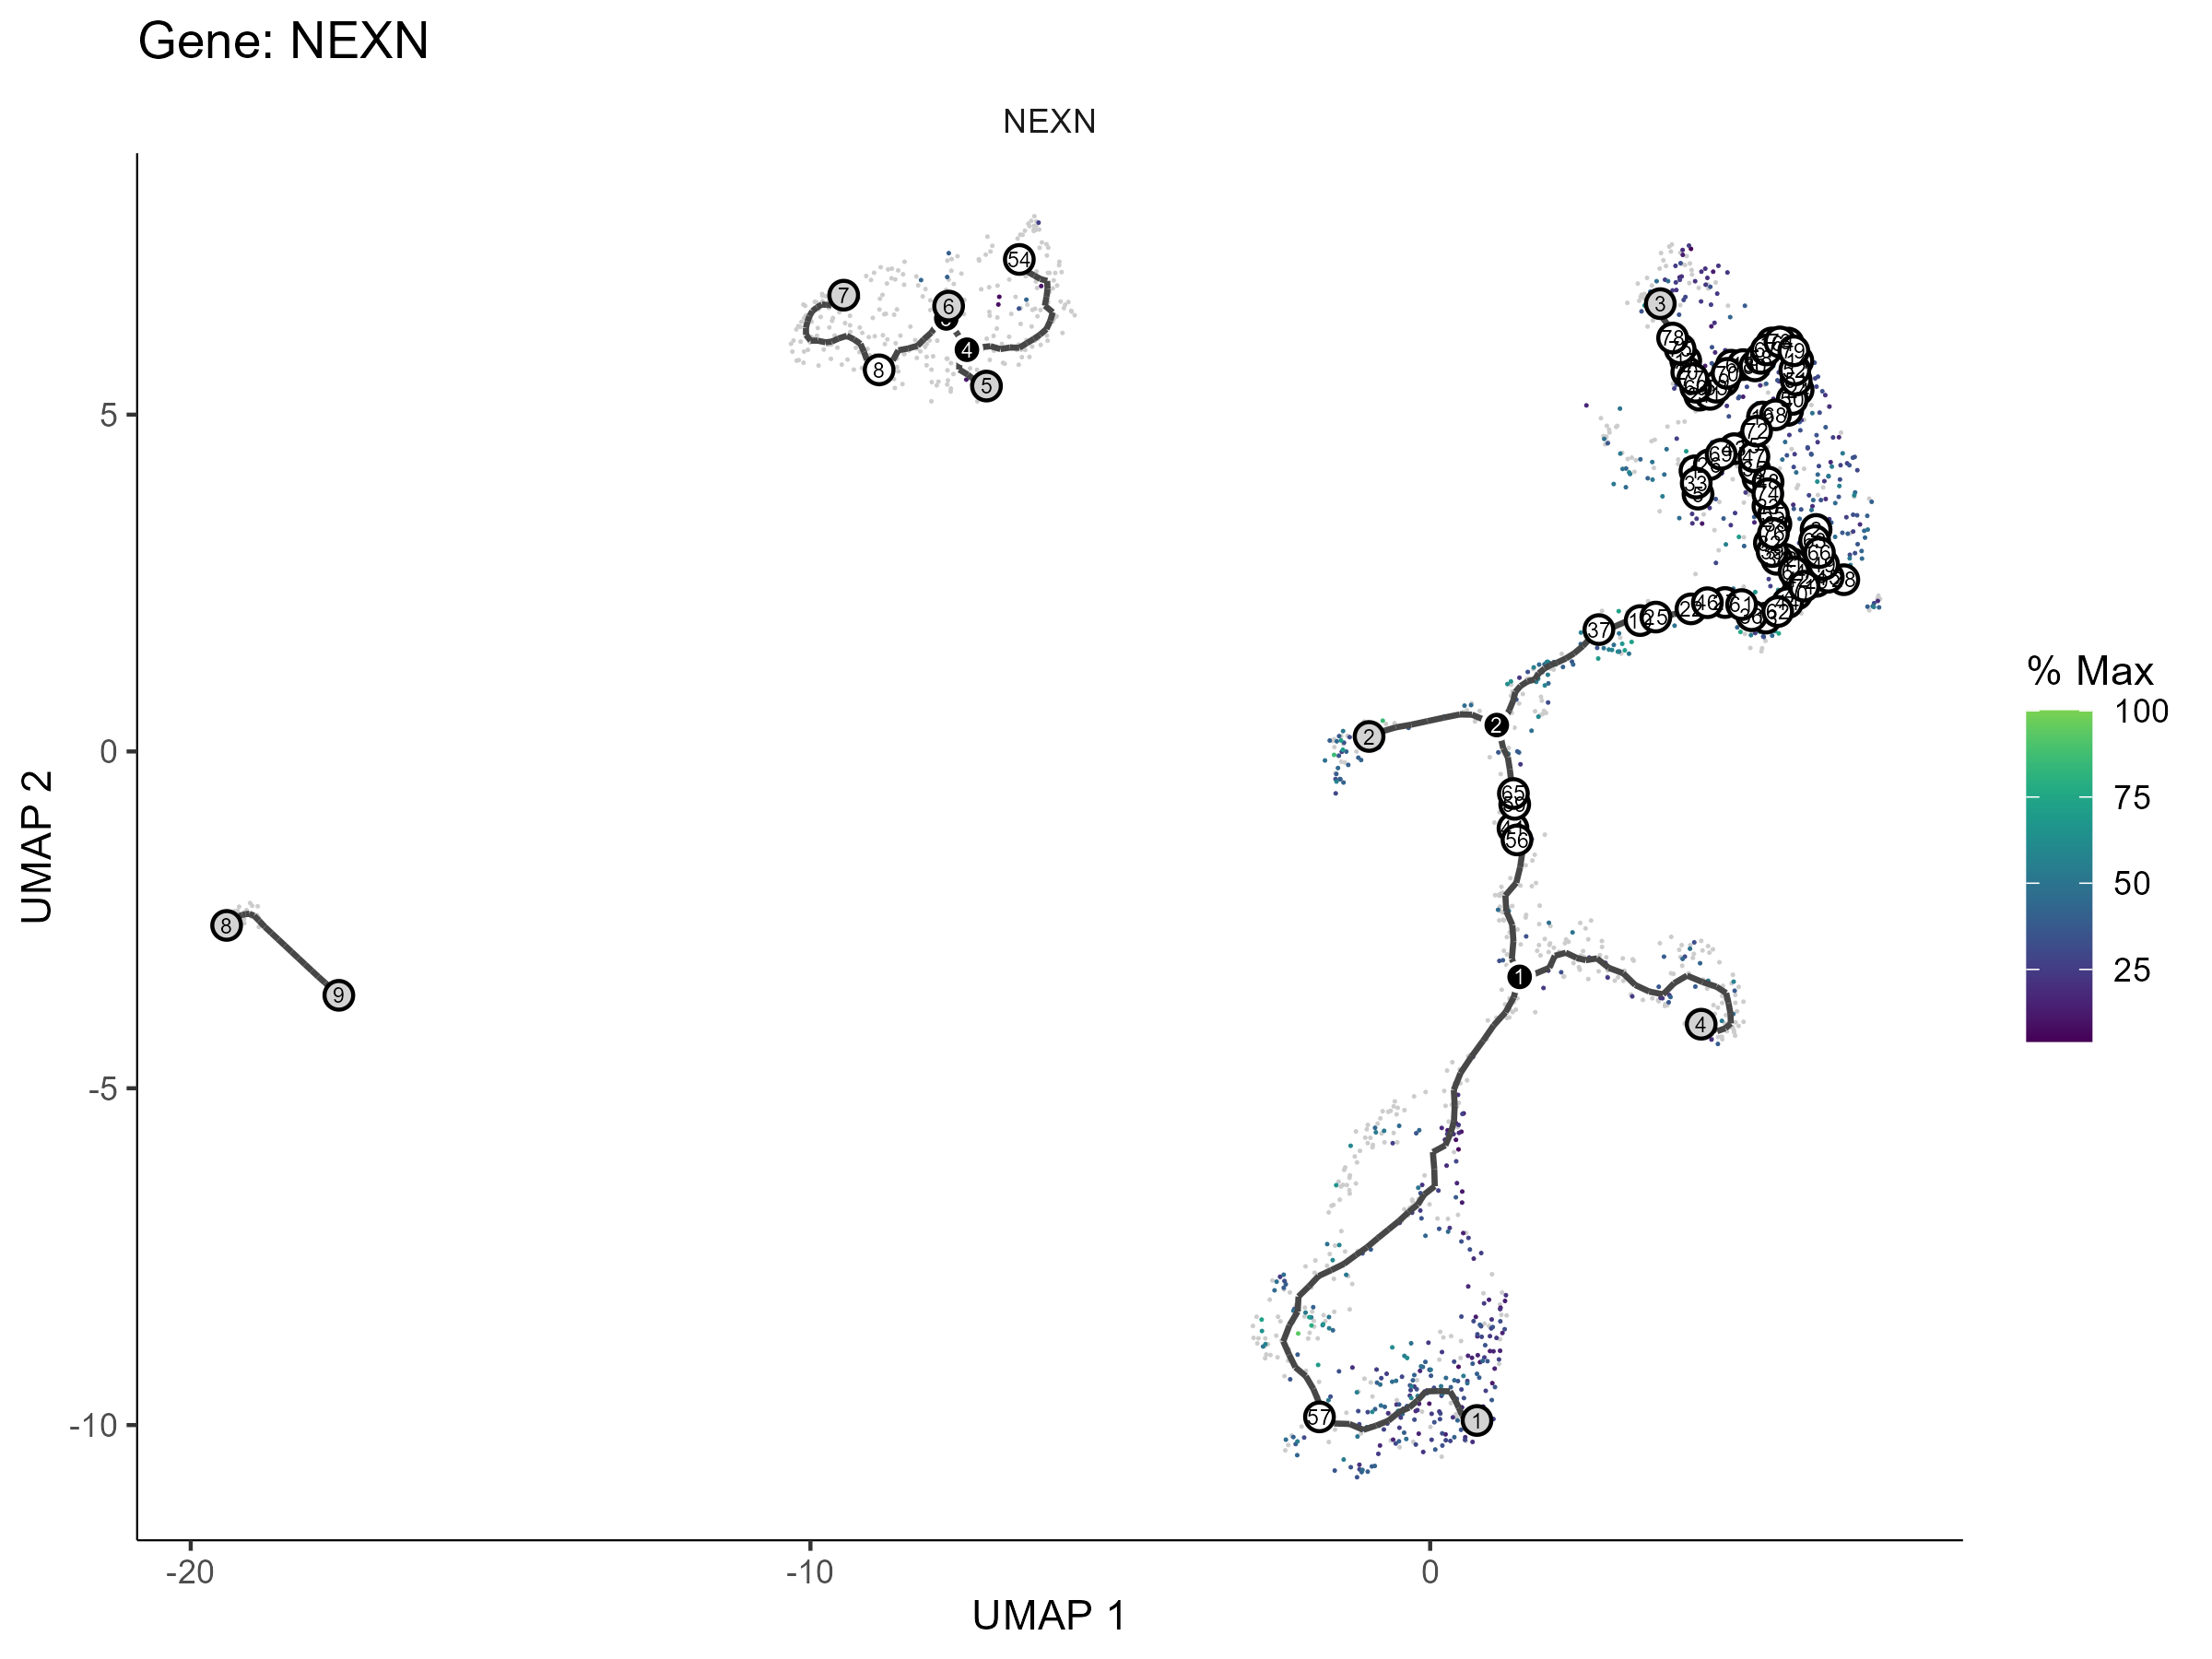
Gene along Trajectory
scRNA-seq-pseudotime · any gene's expression over pseudotime.
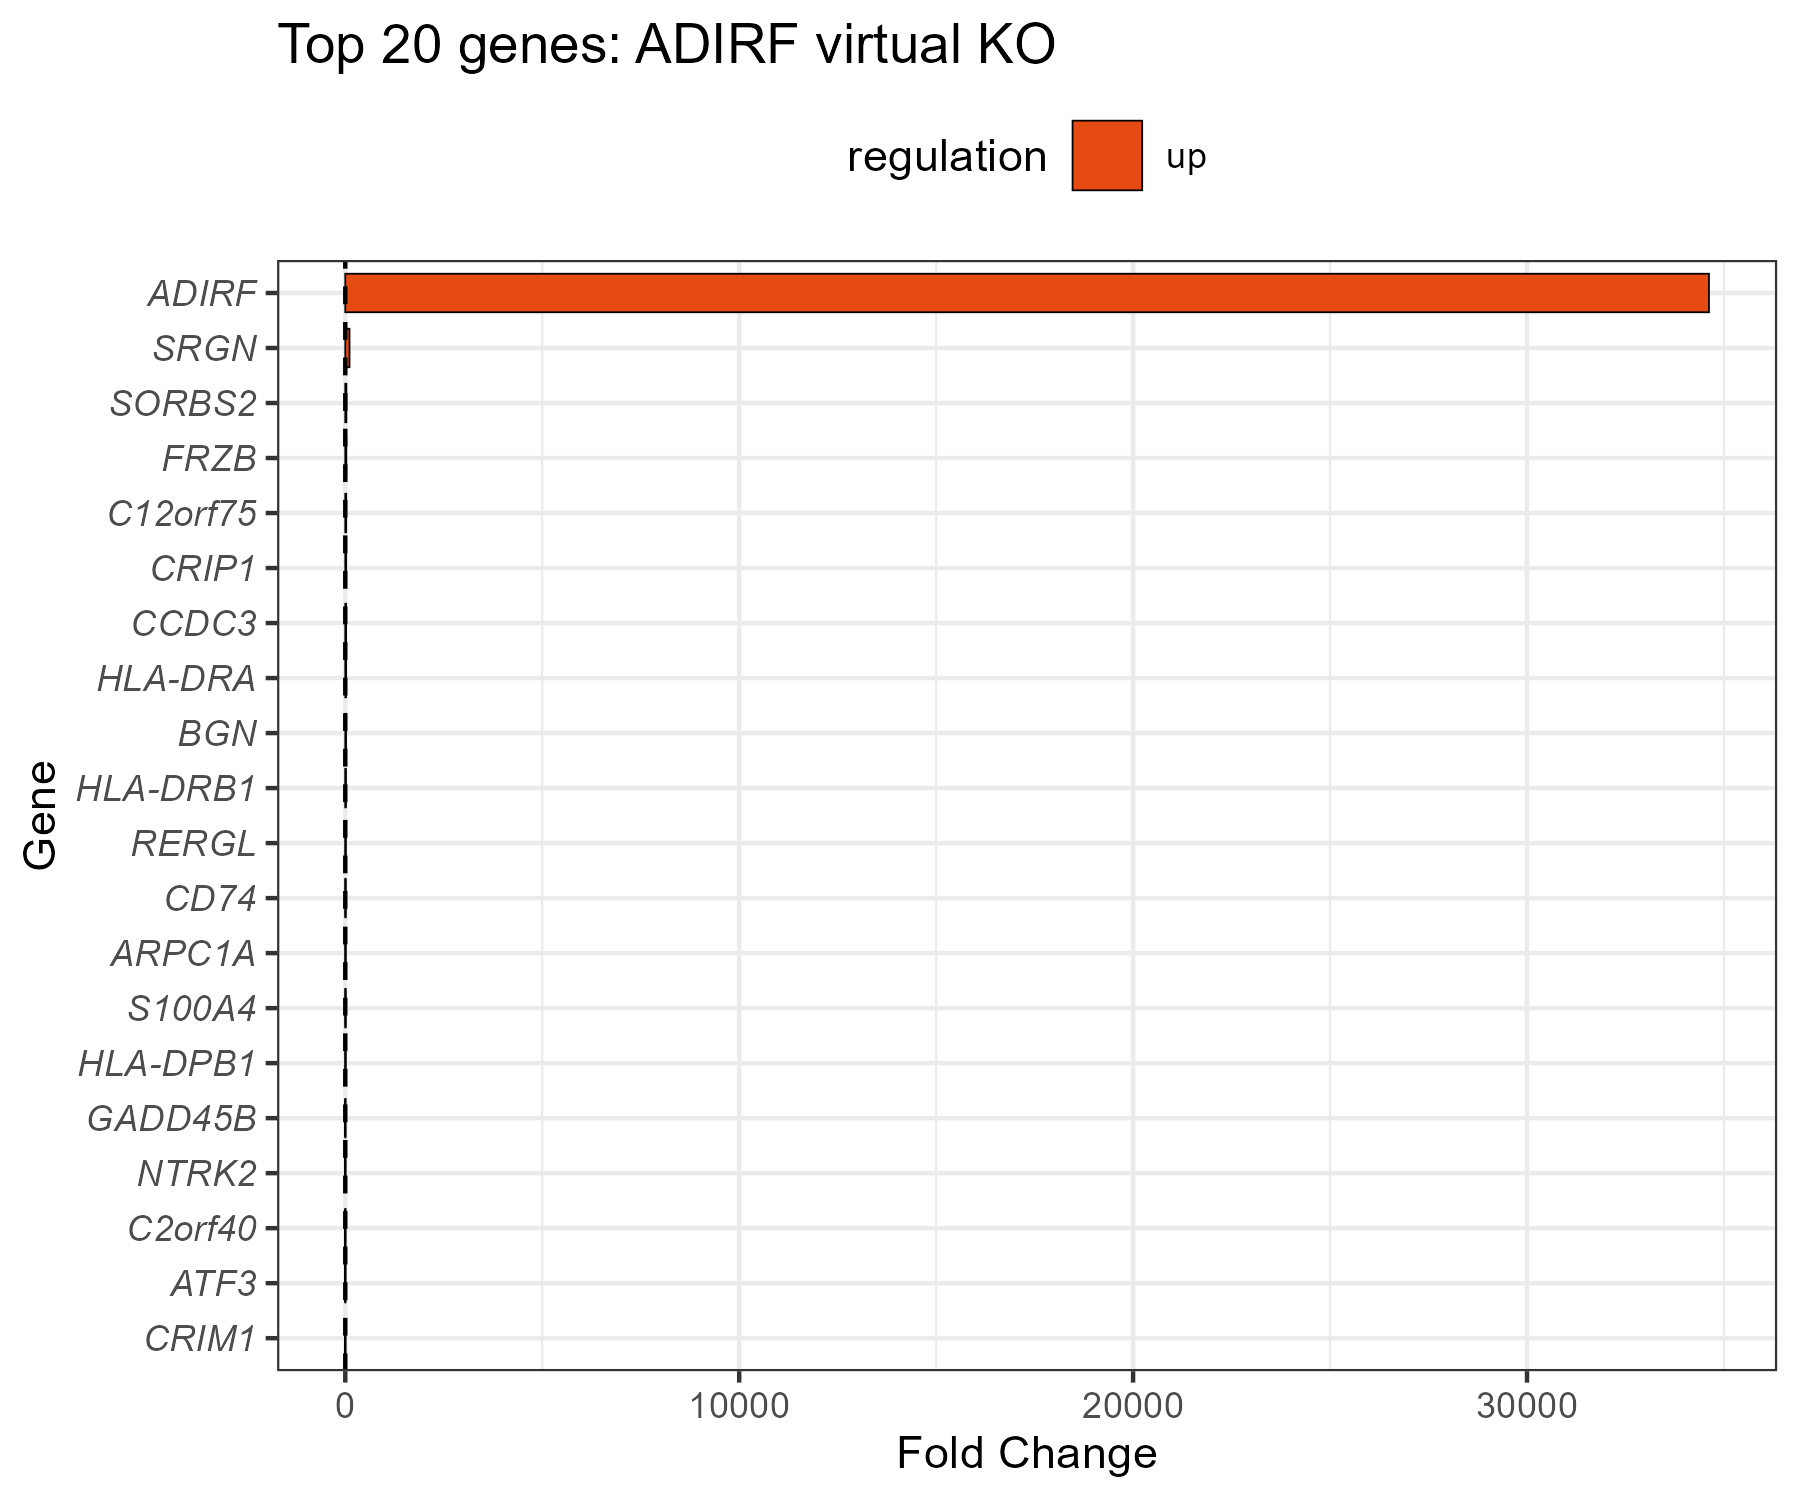
Virtual KO — Top Targets
scRNA-seq-virtual-ko · scTenifoldKnk in-silico knockout ranking.
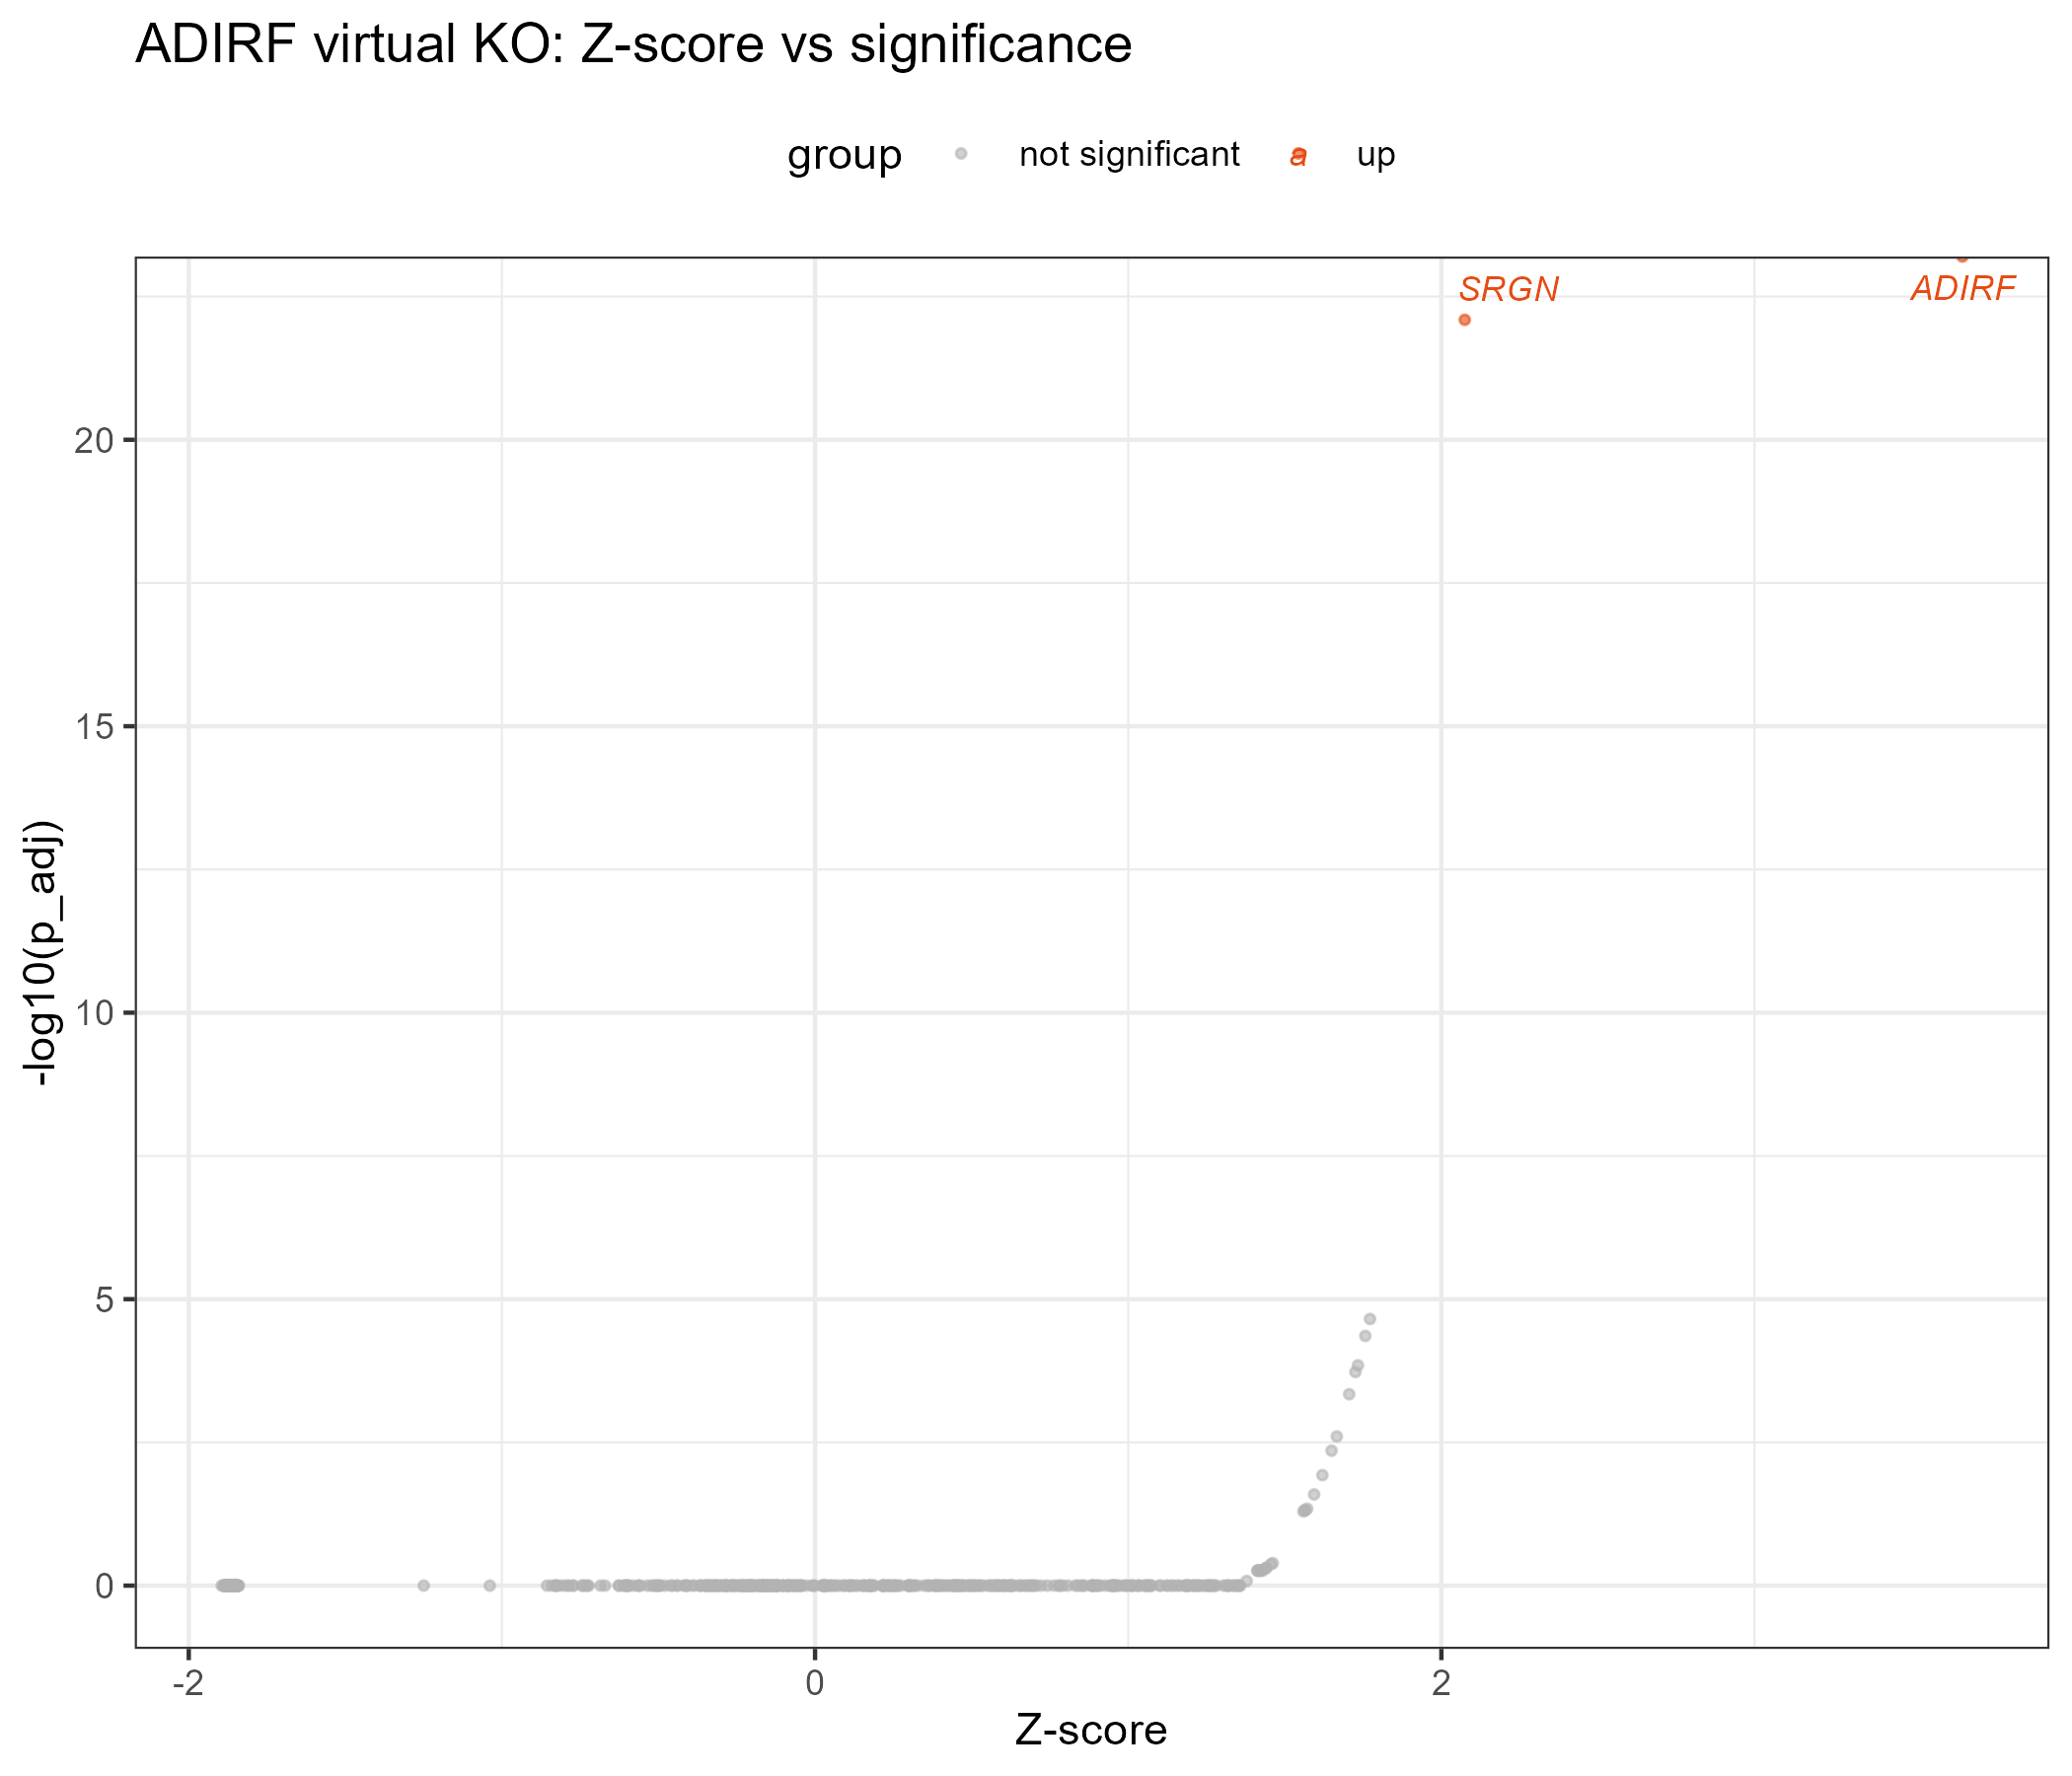
Virtual KO — Z-score Scatter
scRNA-seq-virtual-ko · differential regulation after in-silico KO.
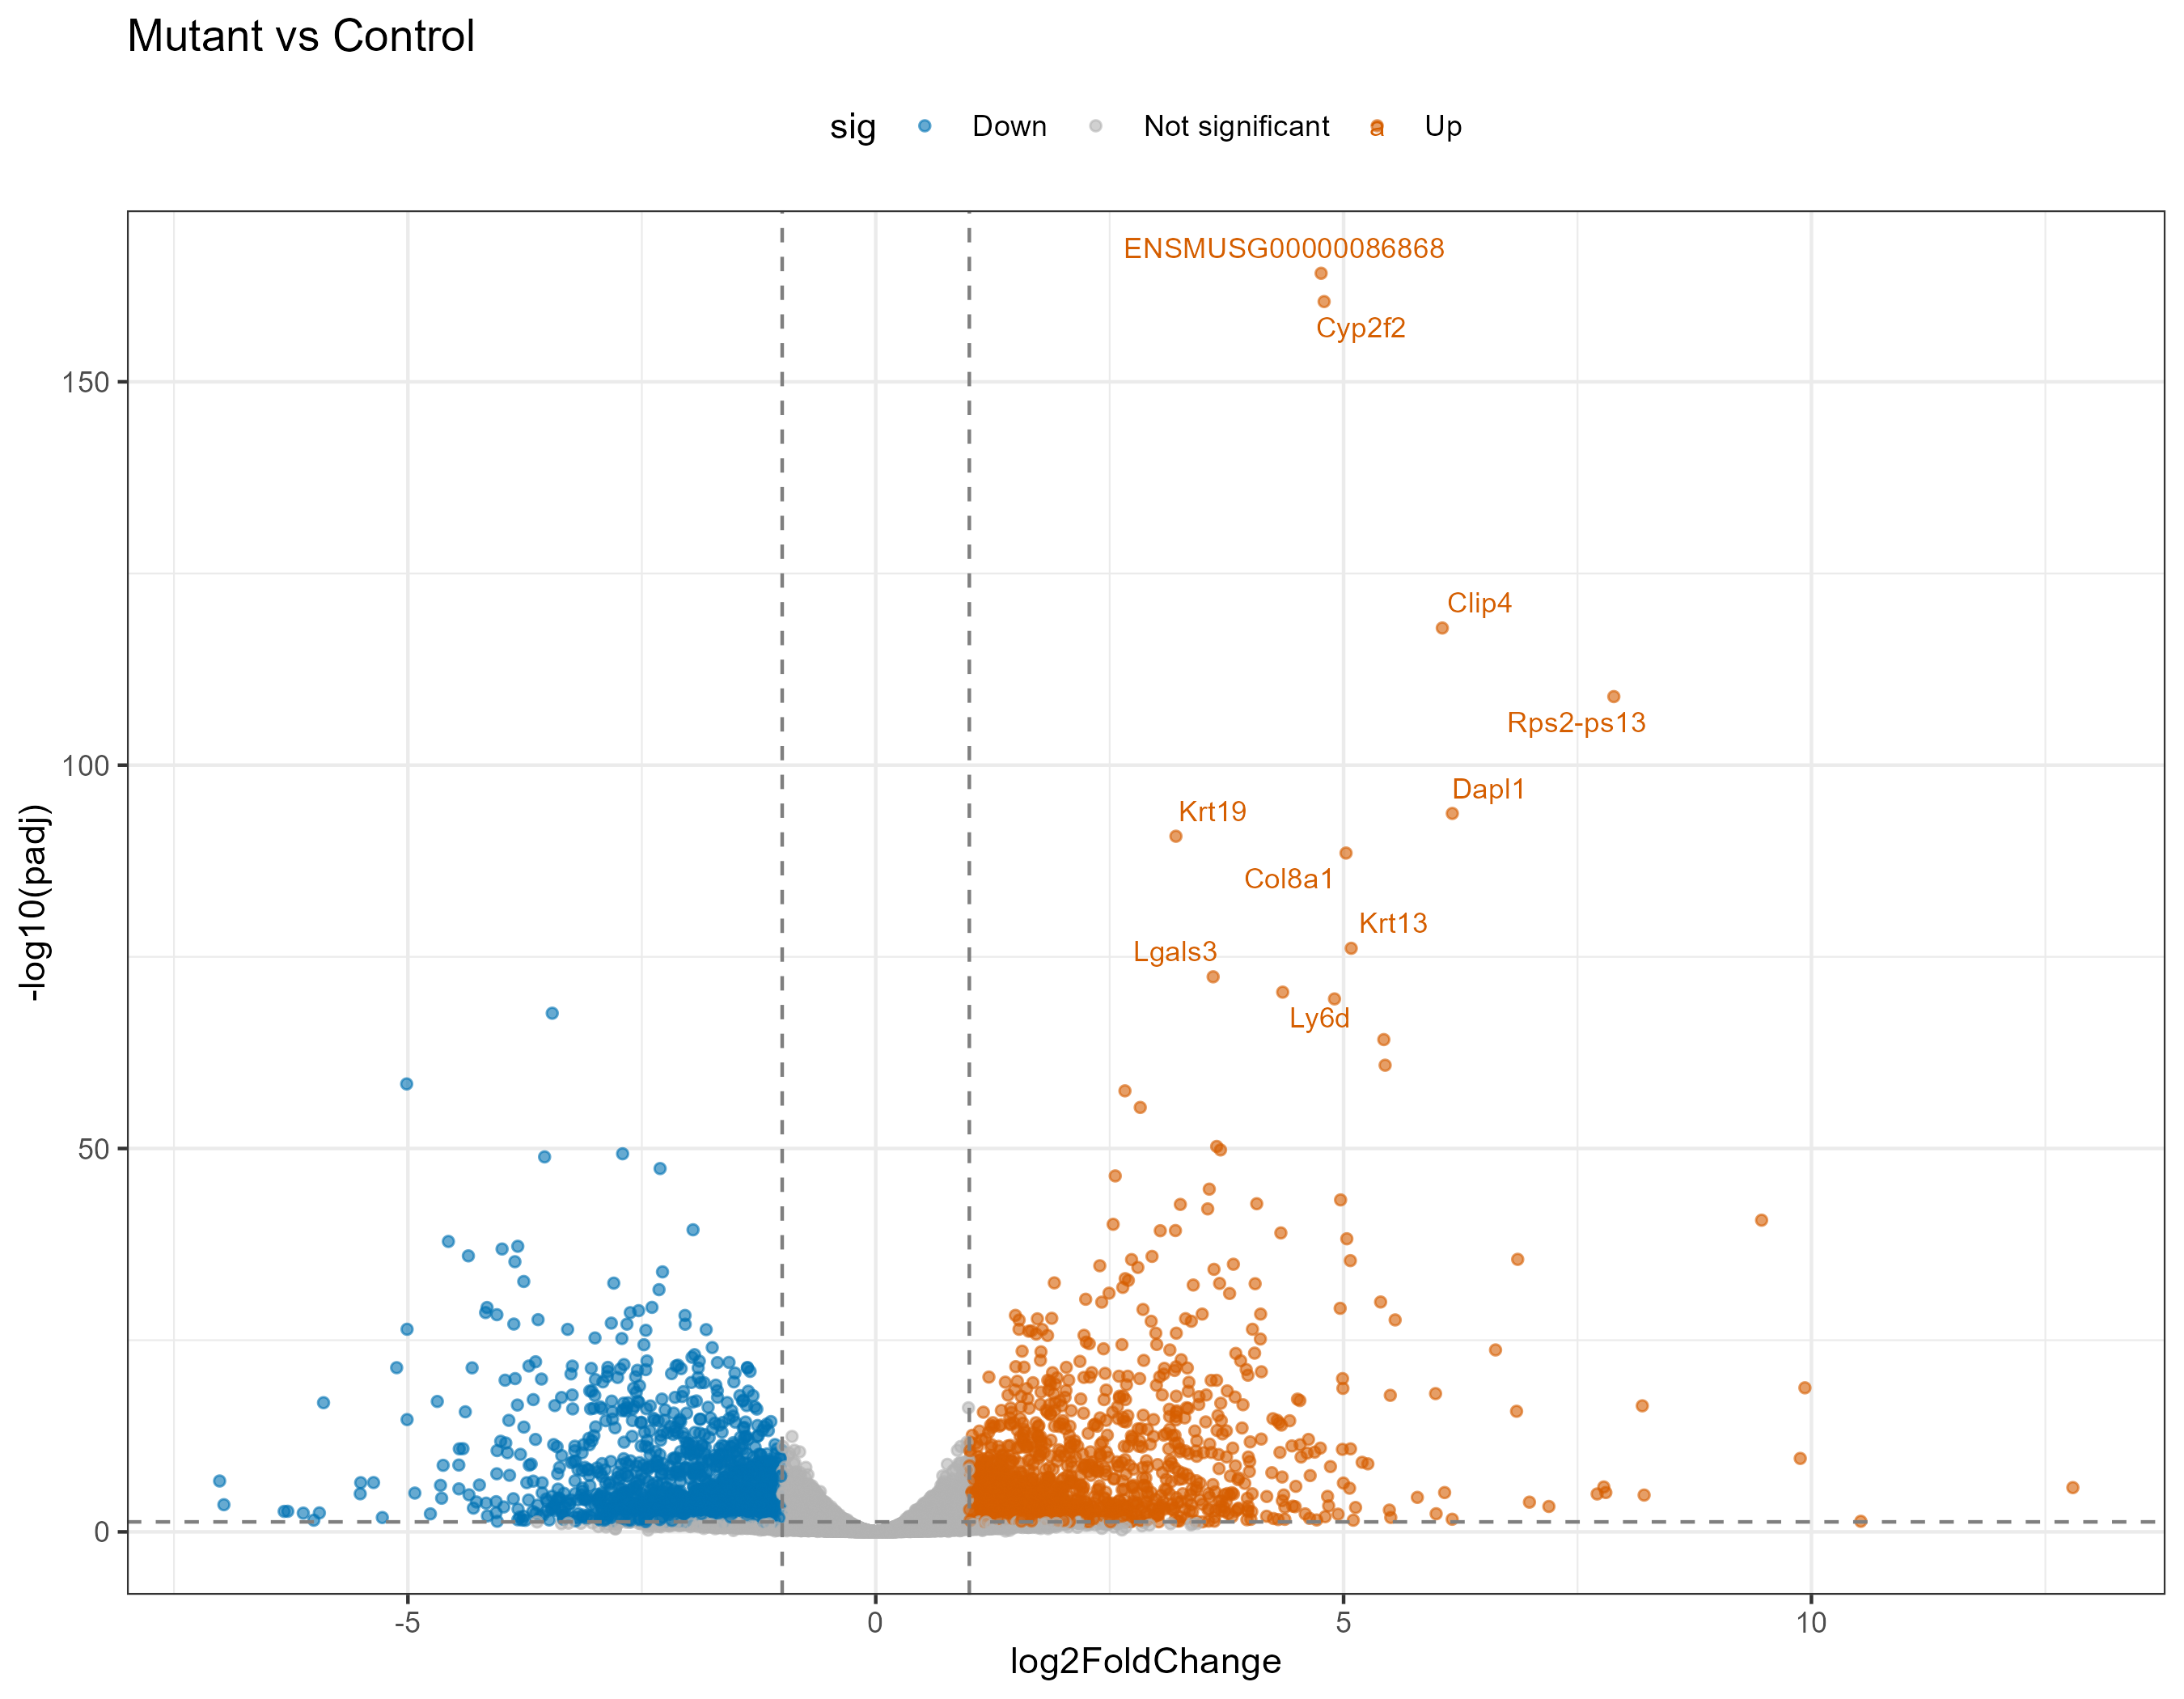
Volcano Plot
bulk-RNA-seq · counts → QC → DEG, engine auto-selected (DESeq2/edgeR/limma).
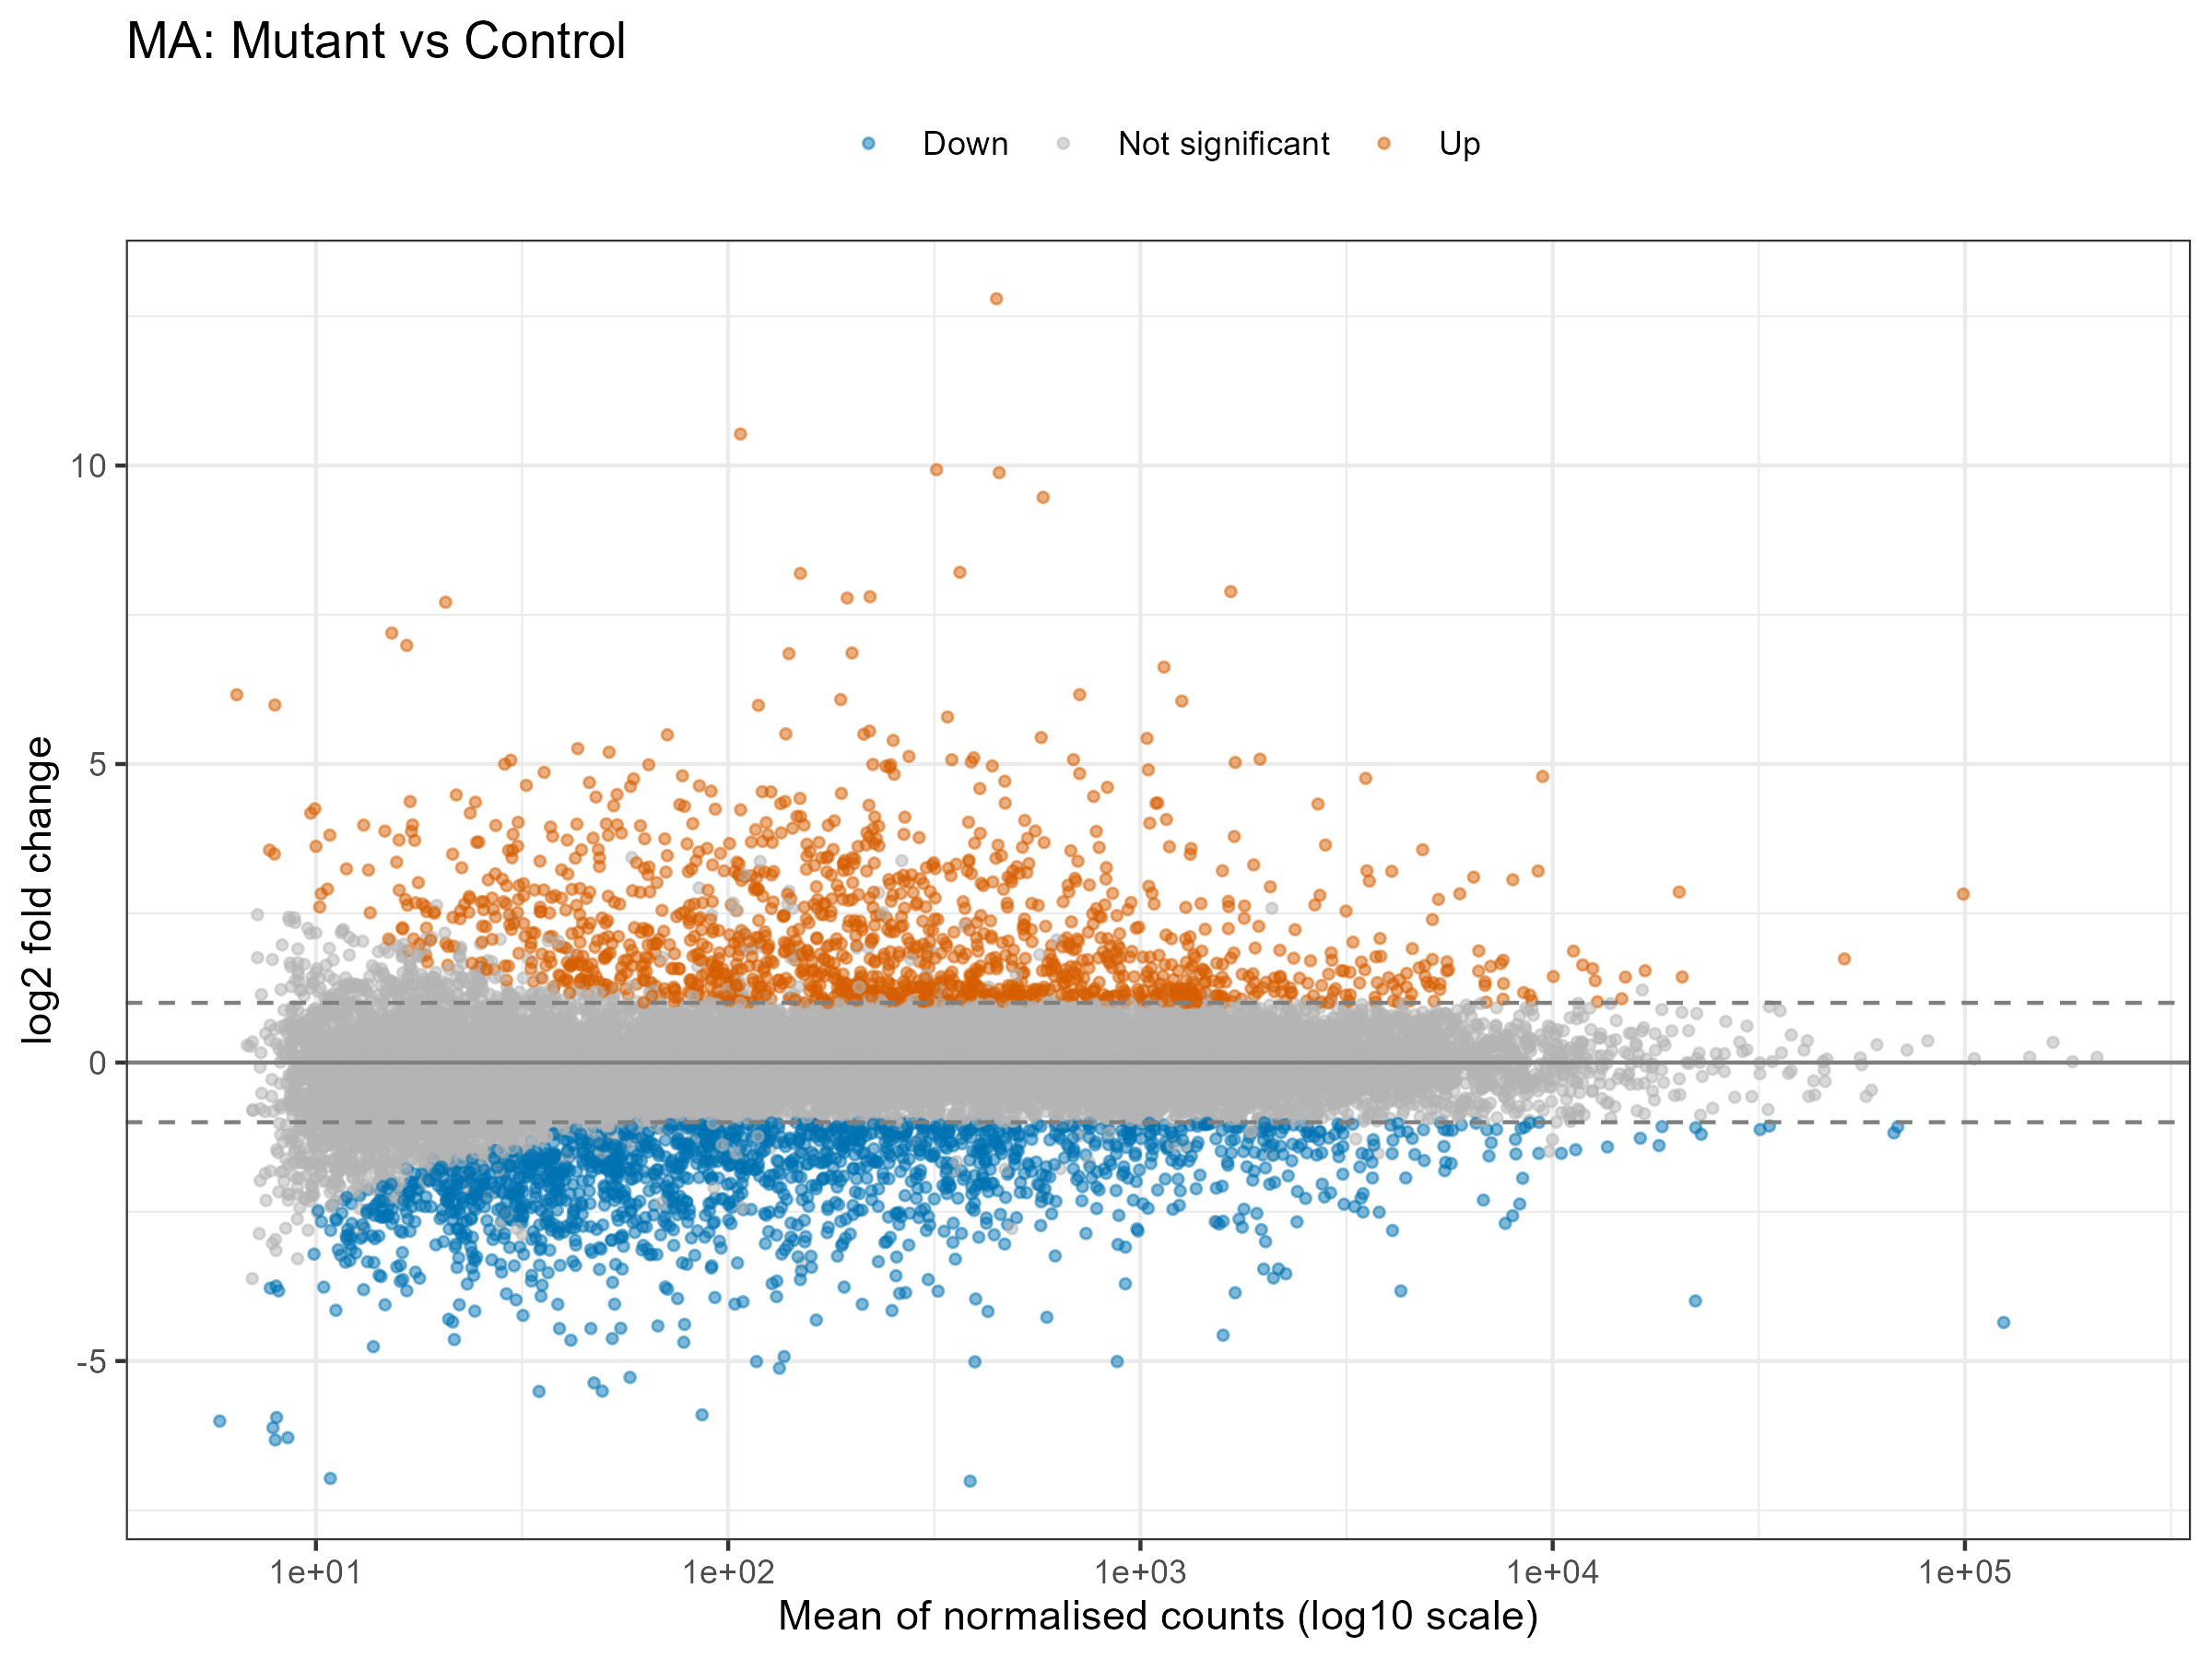
MA Plot
bulk-RNA-seq · log-fold-change vs mean expression per contrast.
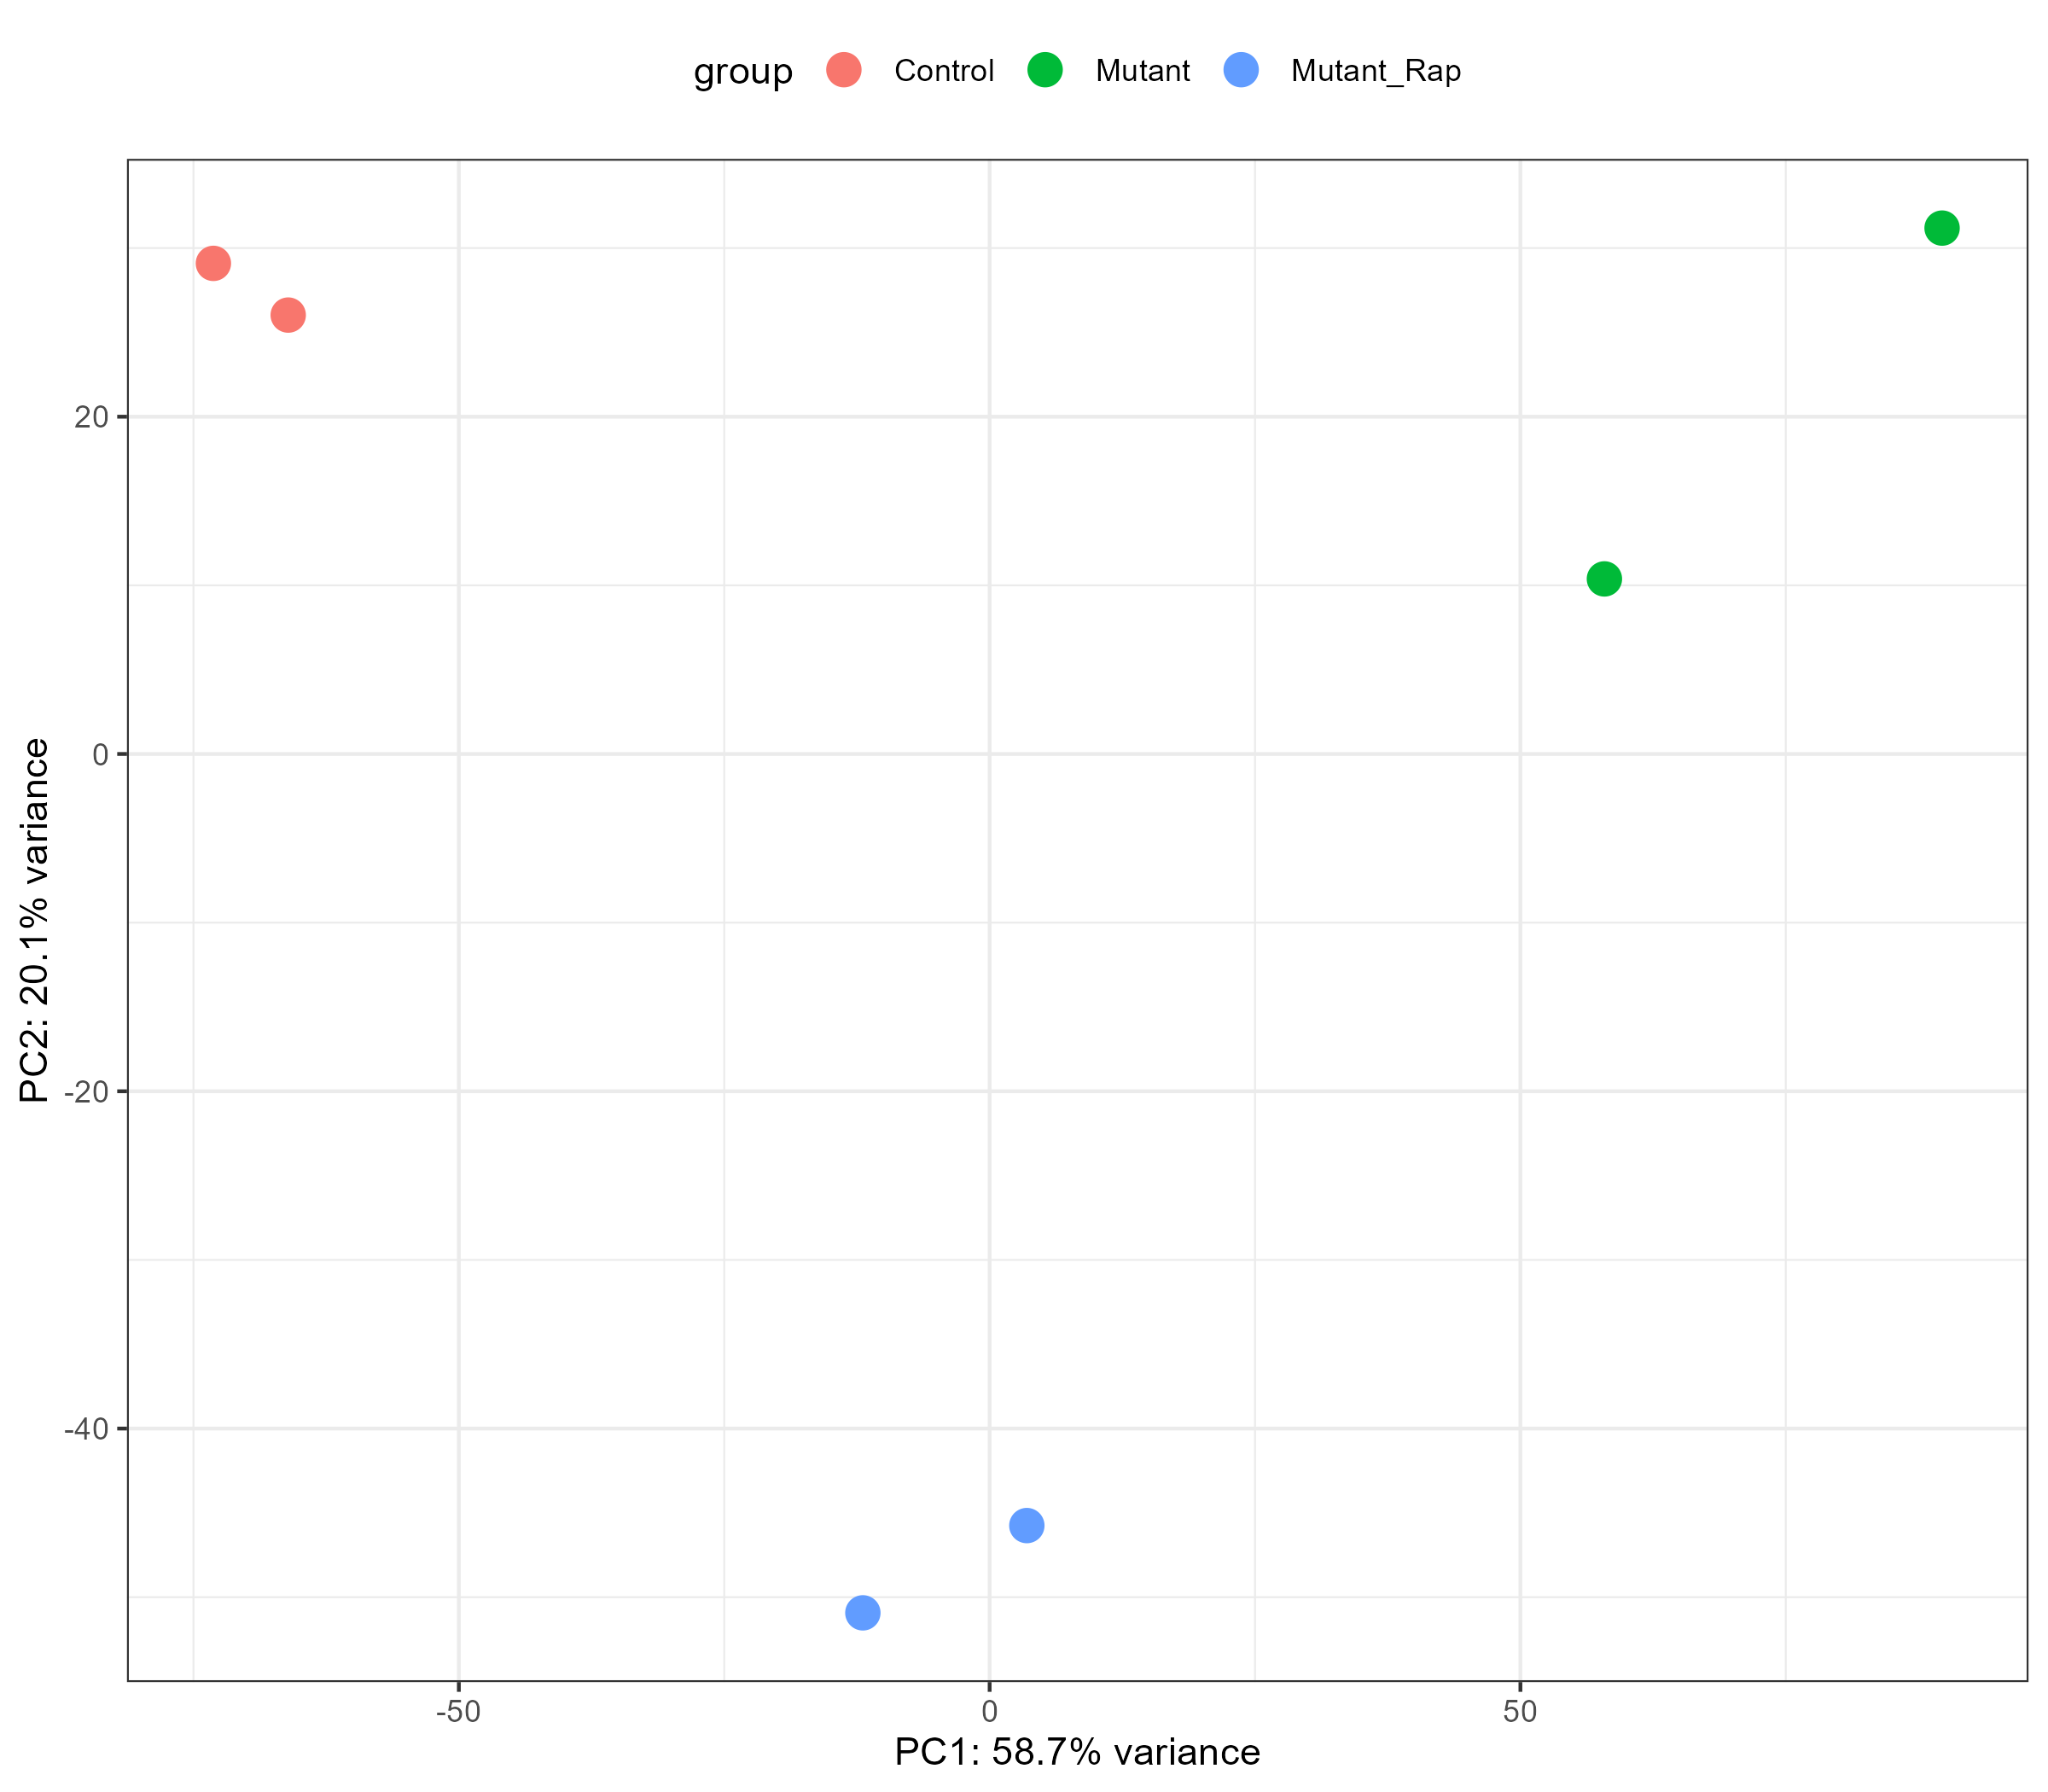
QC — PCA
bulk-RNA-seq · sample-level quality control before any DEG call.
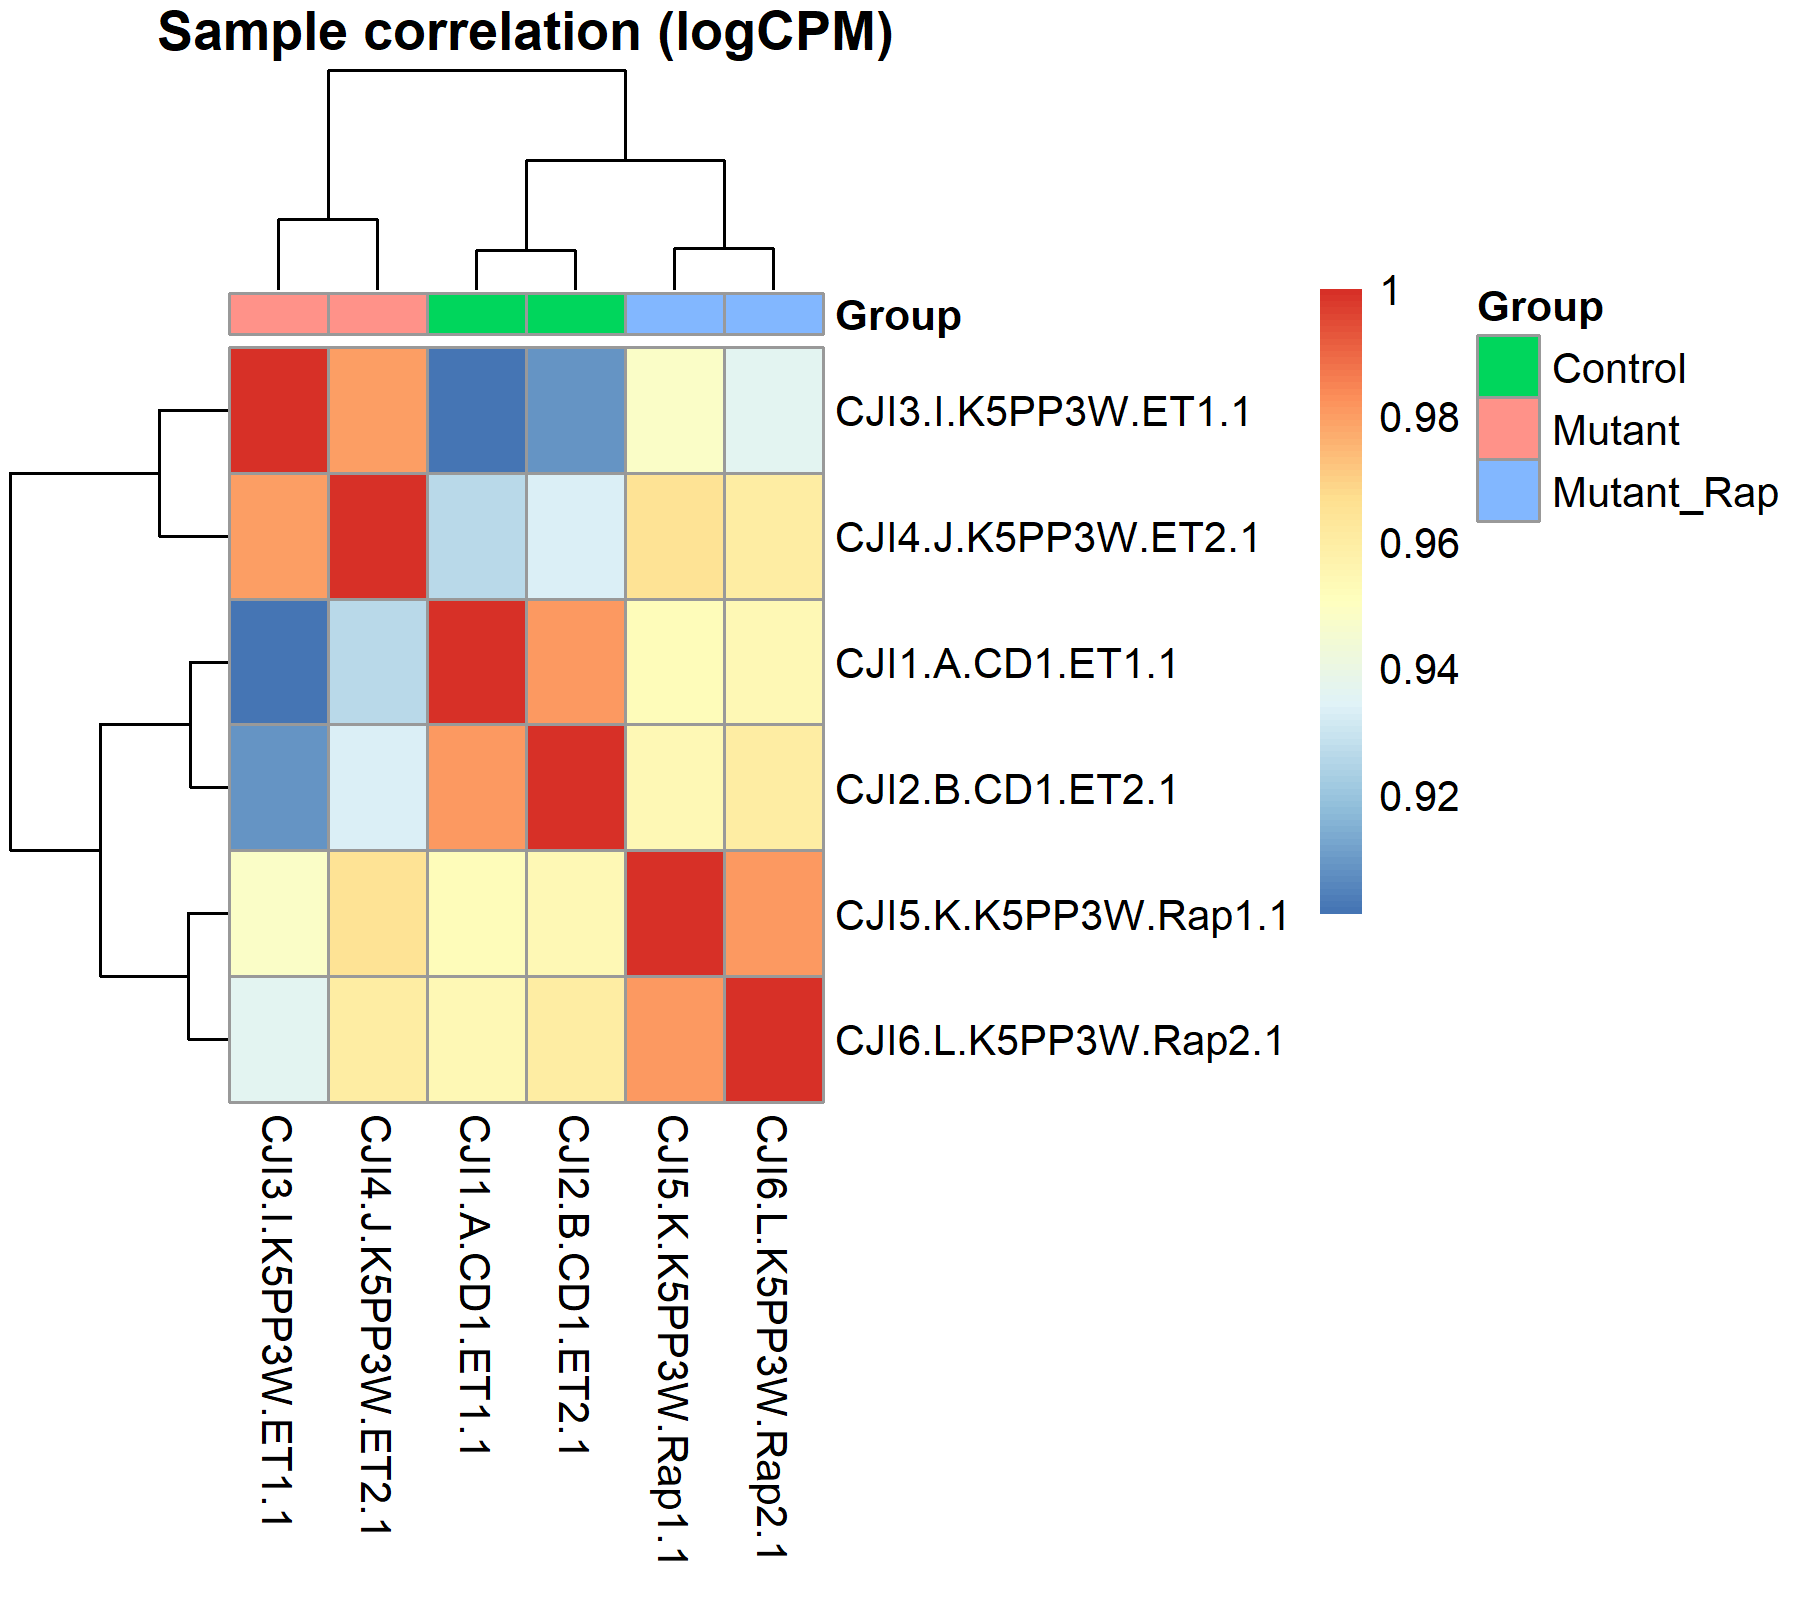
QC — Correlation Heatmap
bulk-RNA-seq · sample-to-sample correlation at a glance.
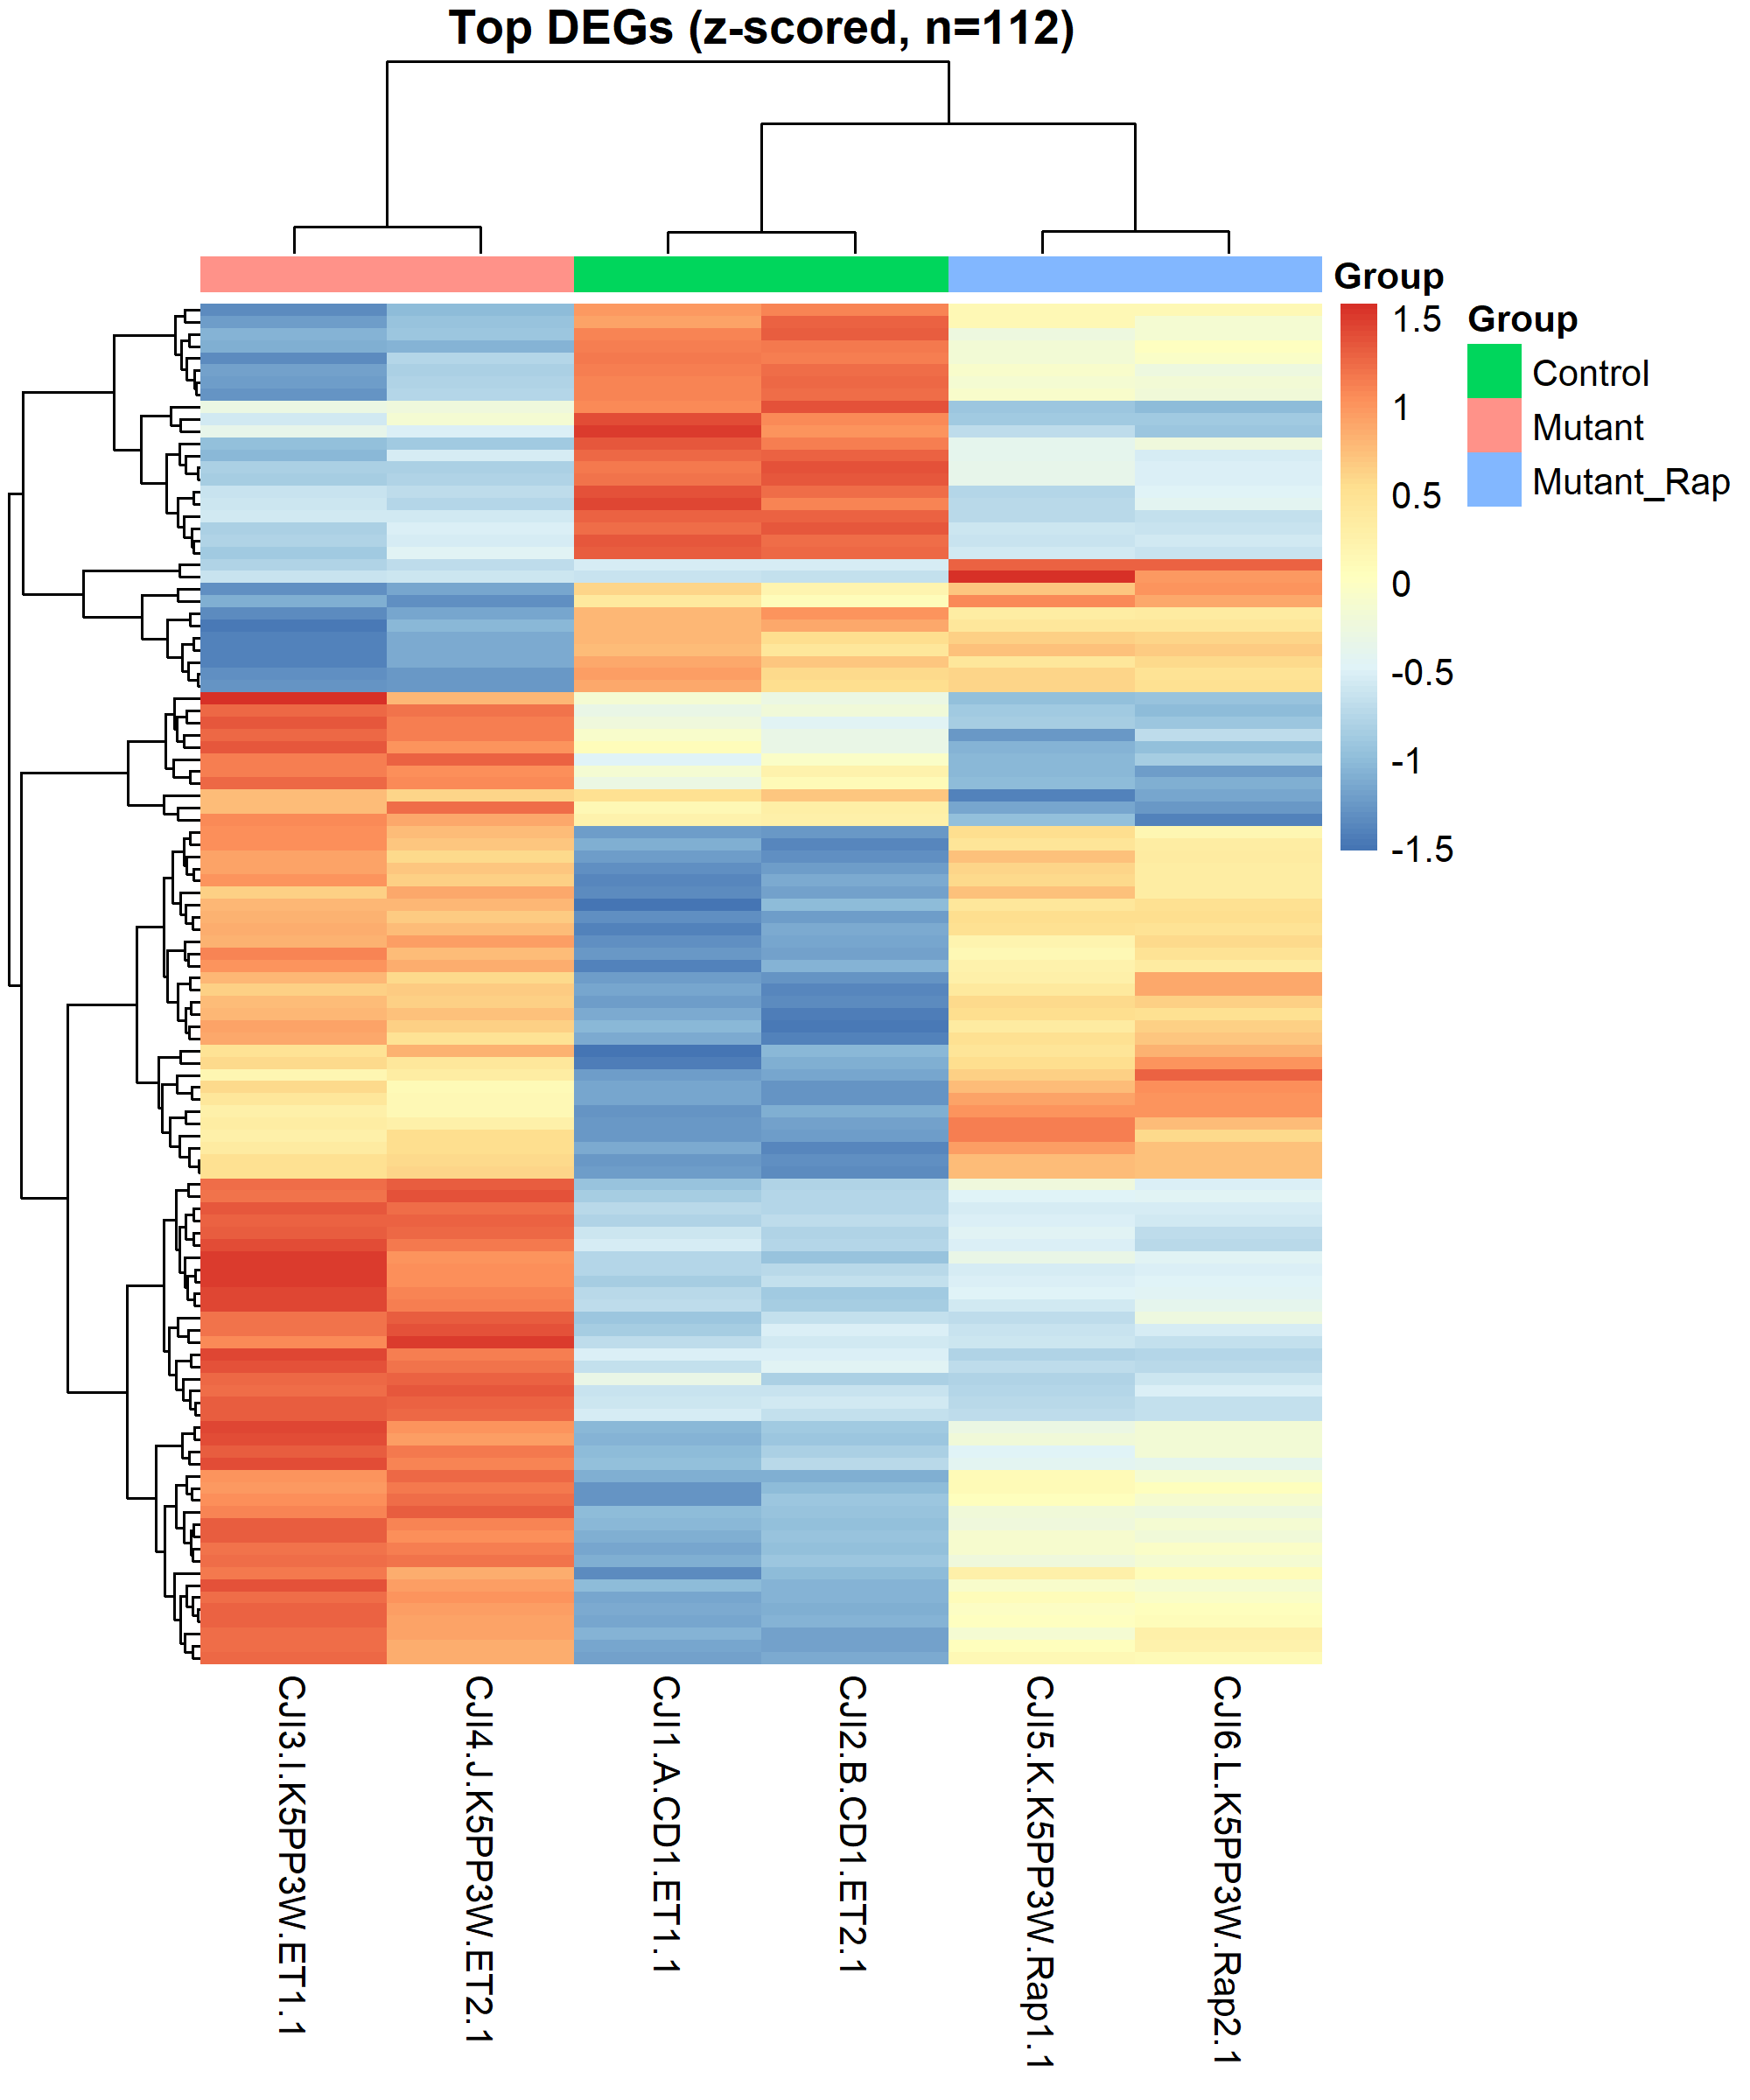
DEG Heatmap
bulk-RNA-seq · top differential genes across all samples.
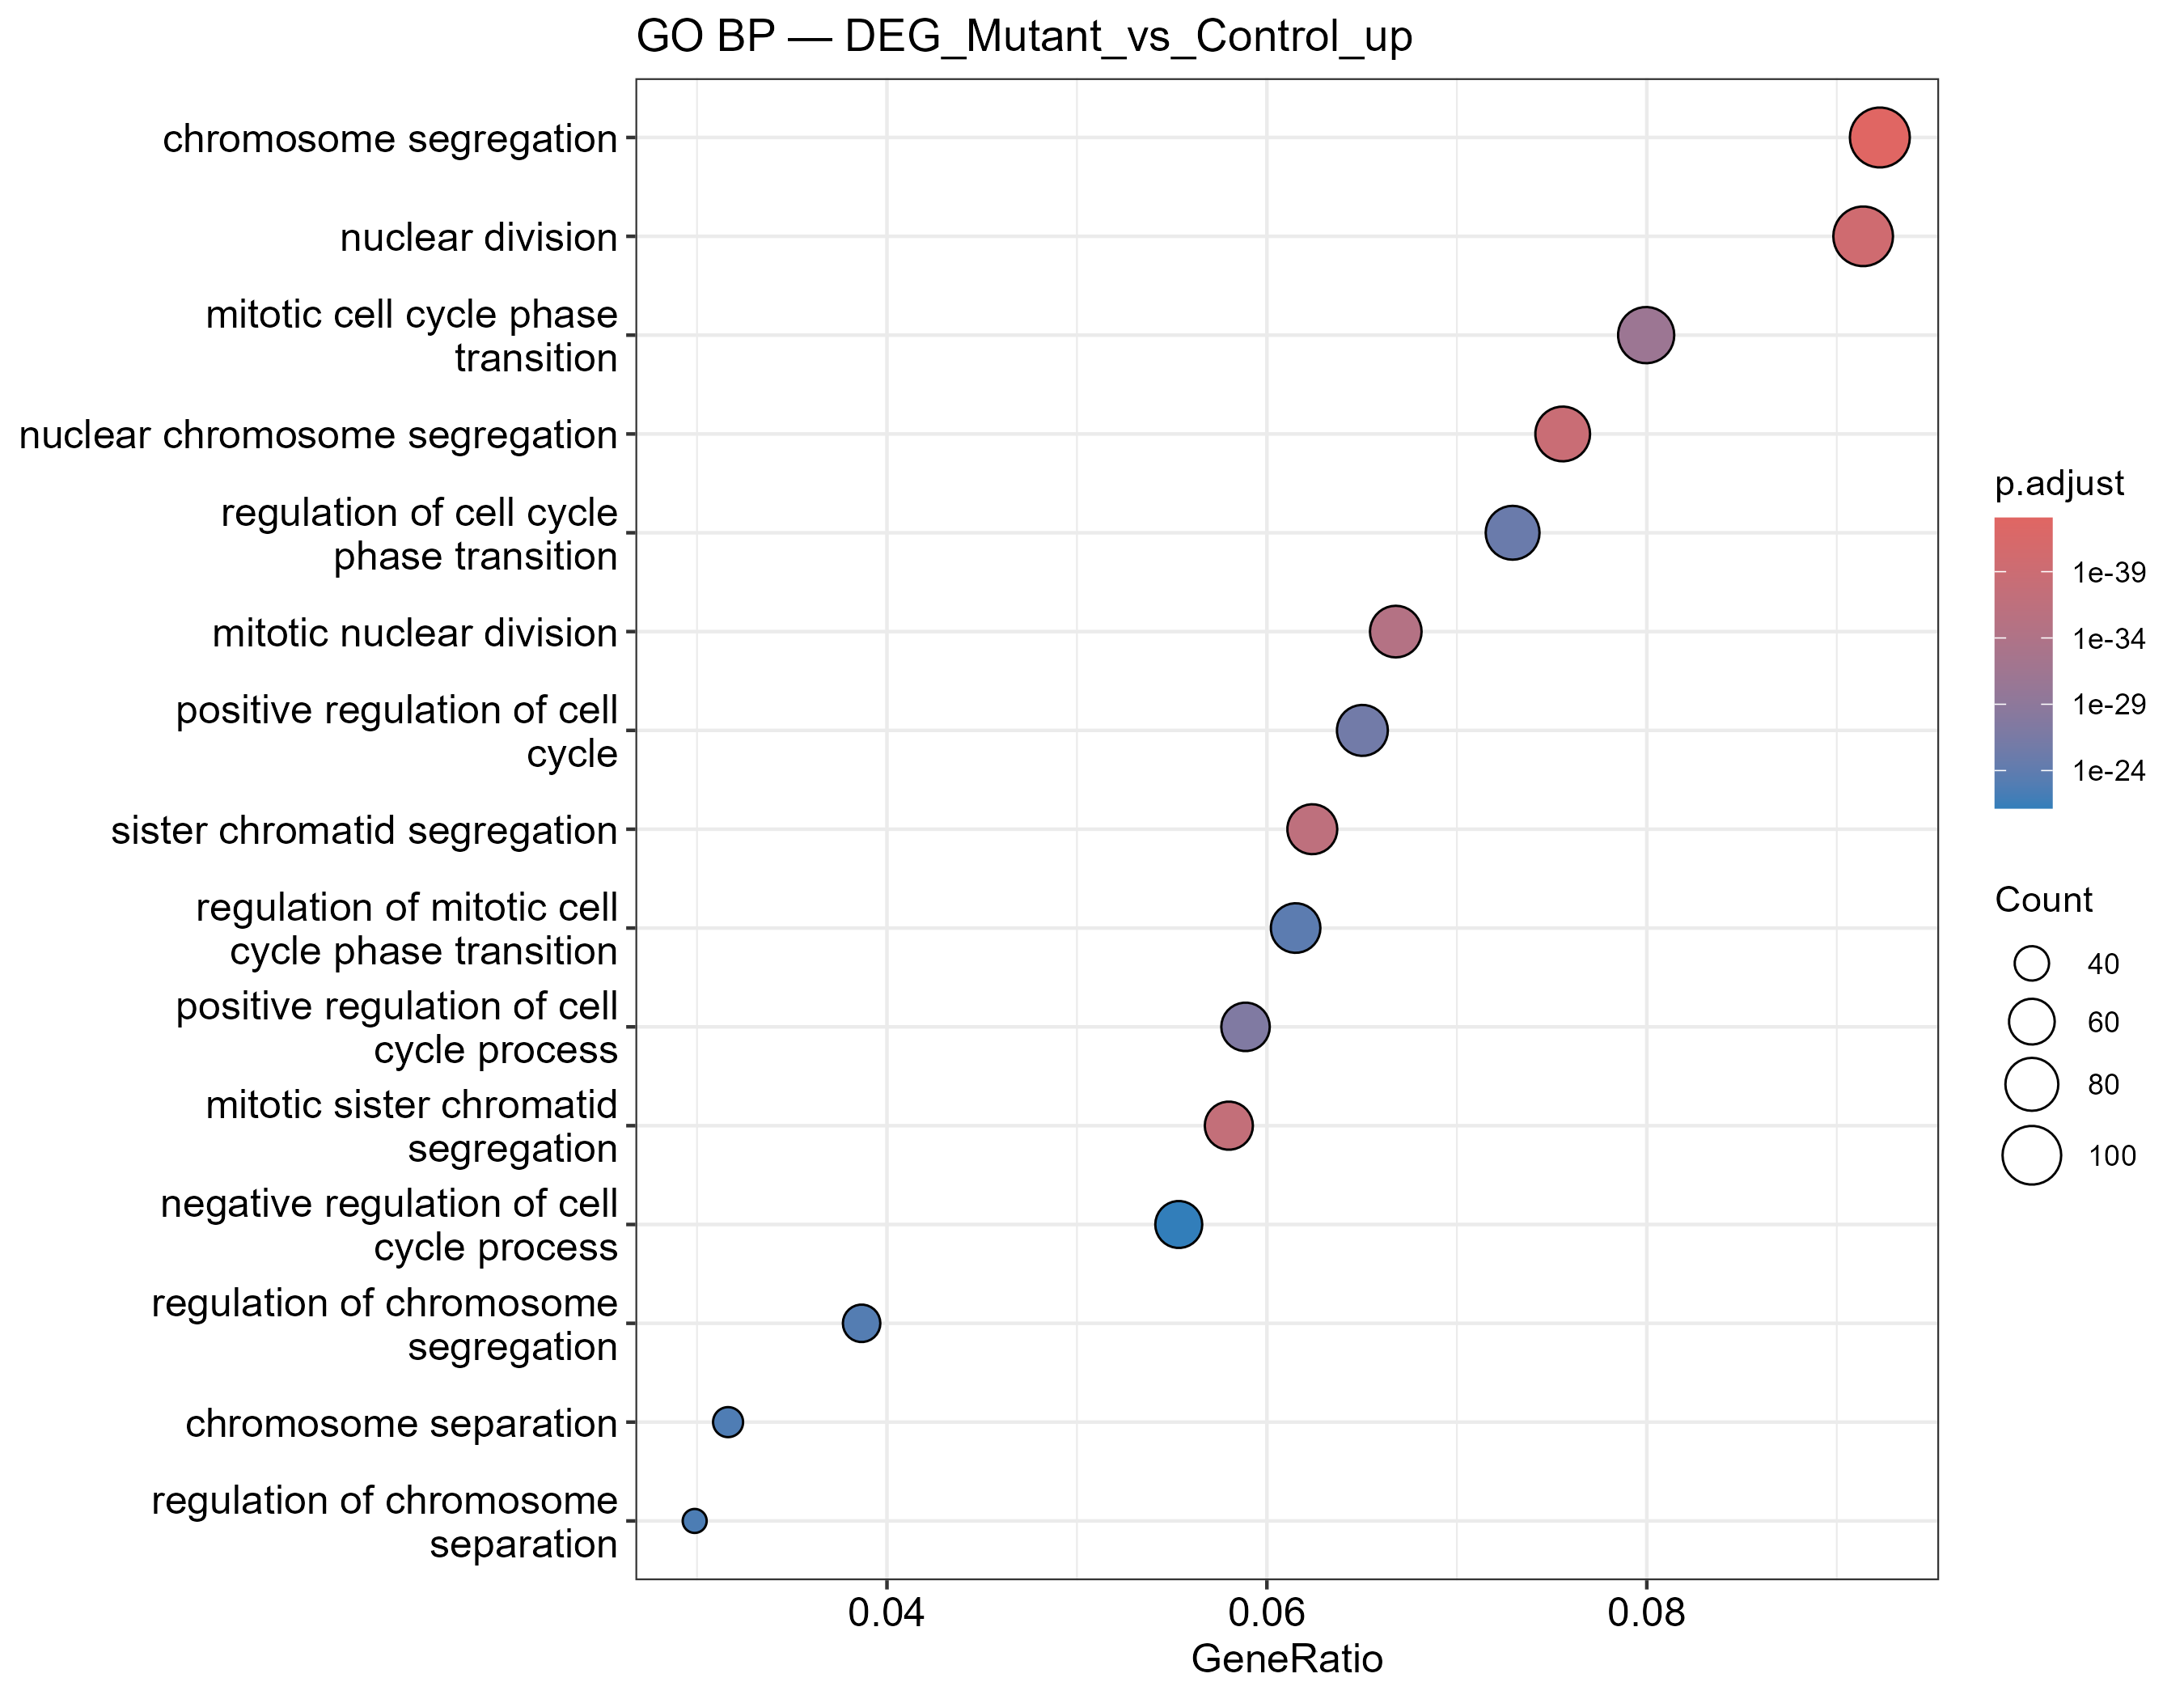
GO Enrichment
RNA-seq-enrichment · BP/CC/MF dotplots, fully offline.
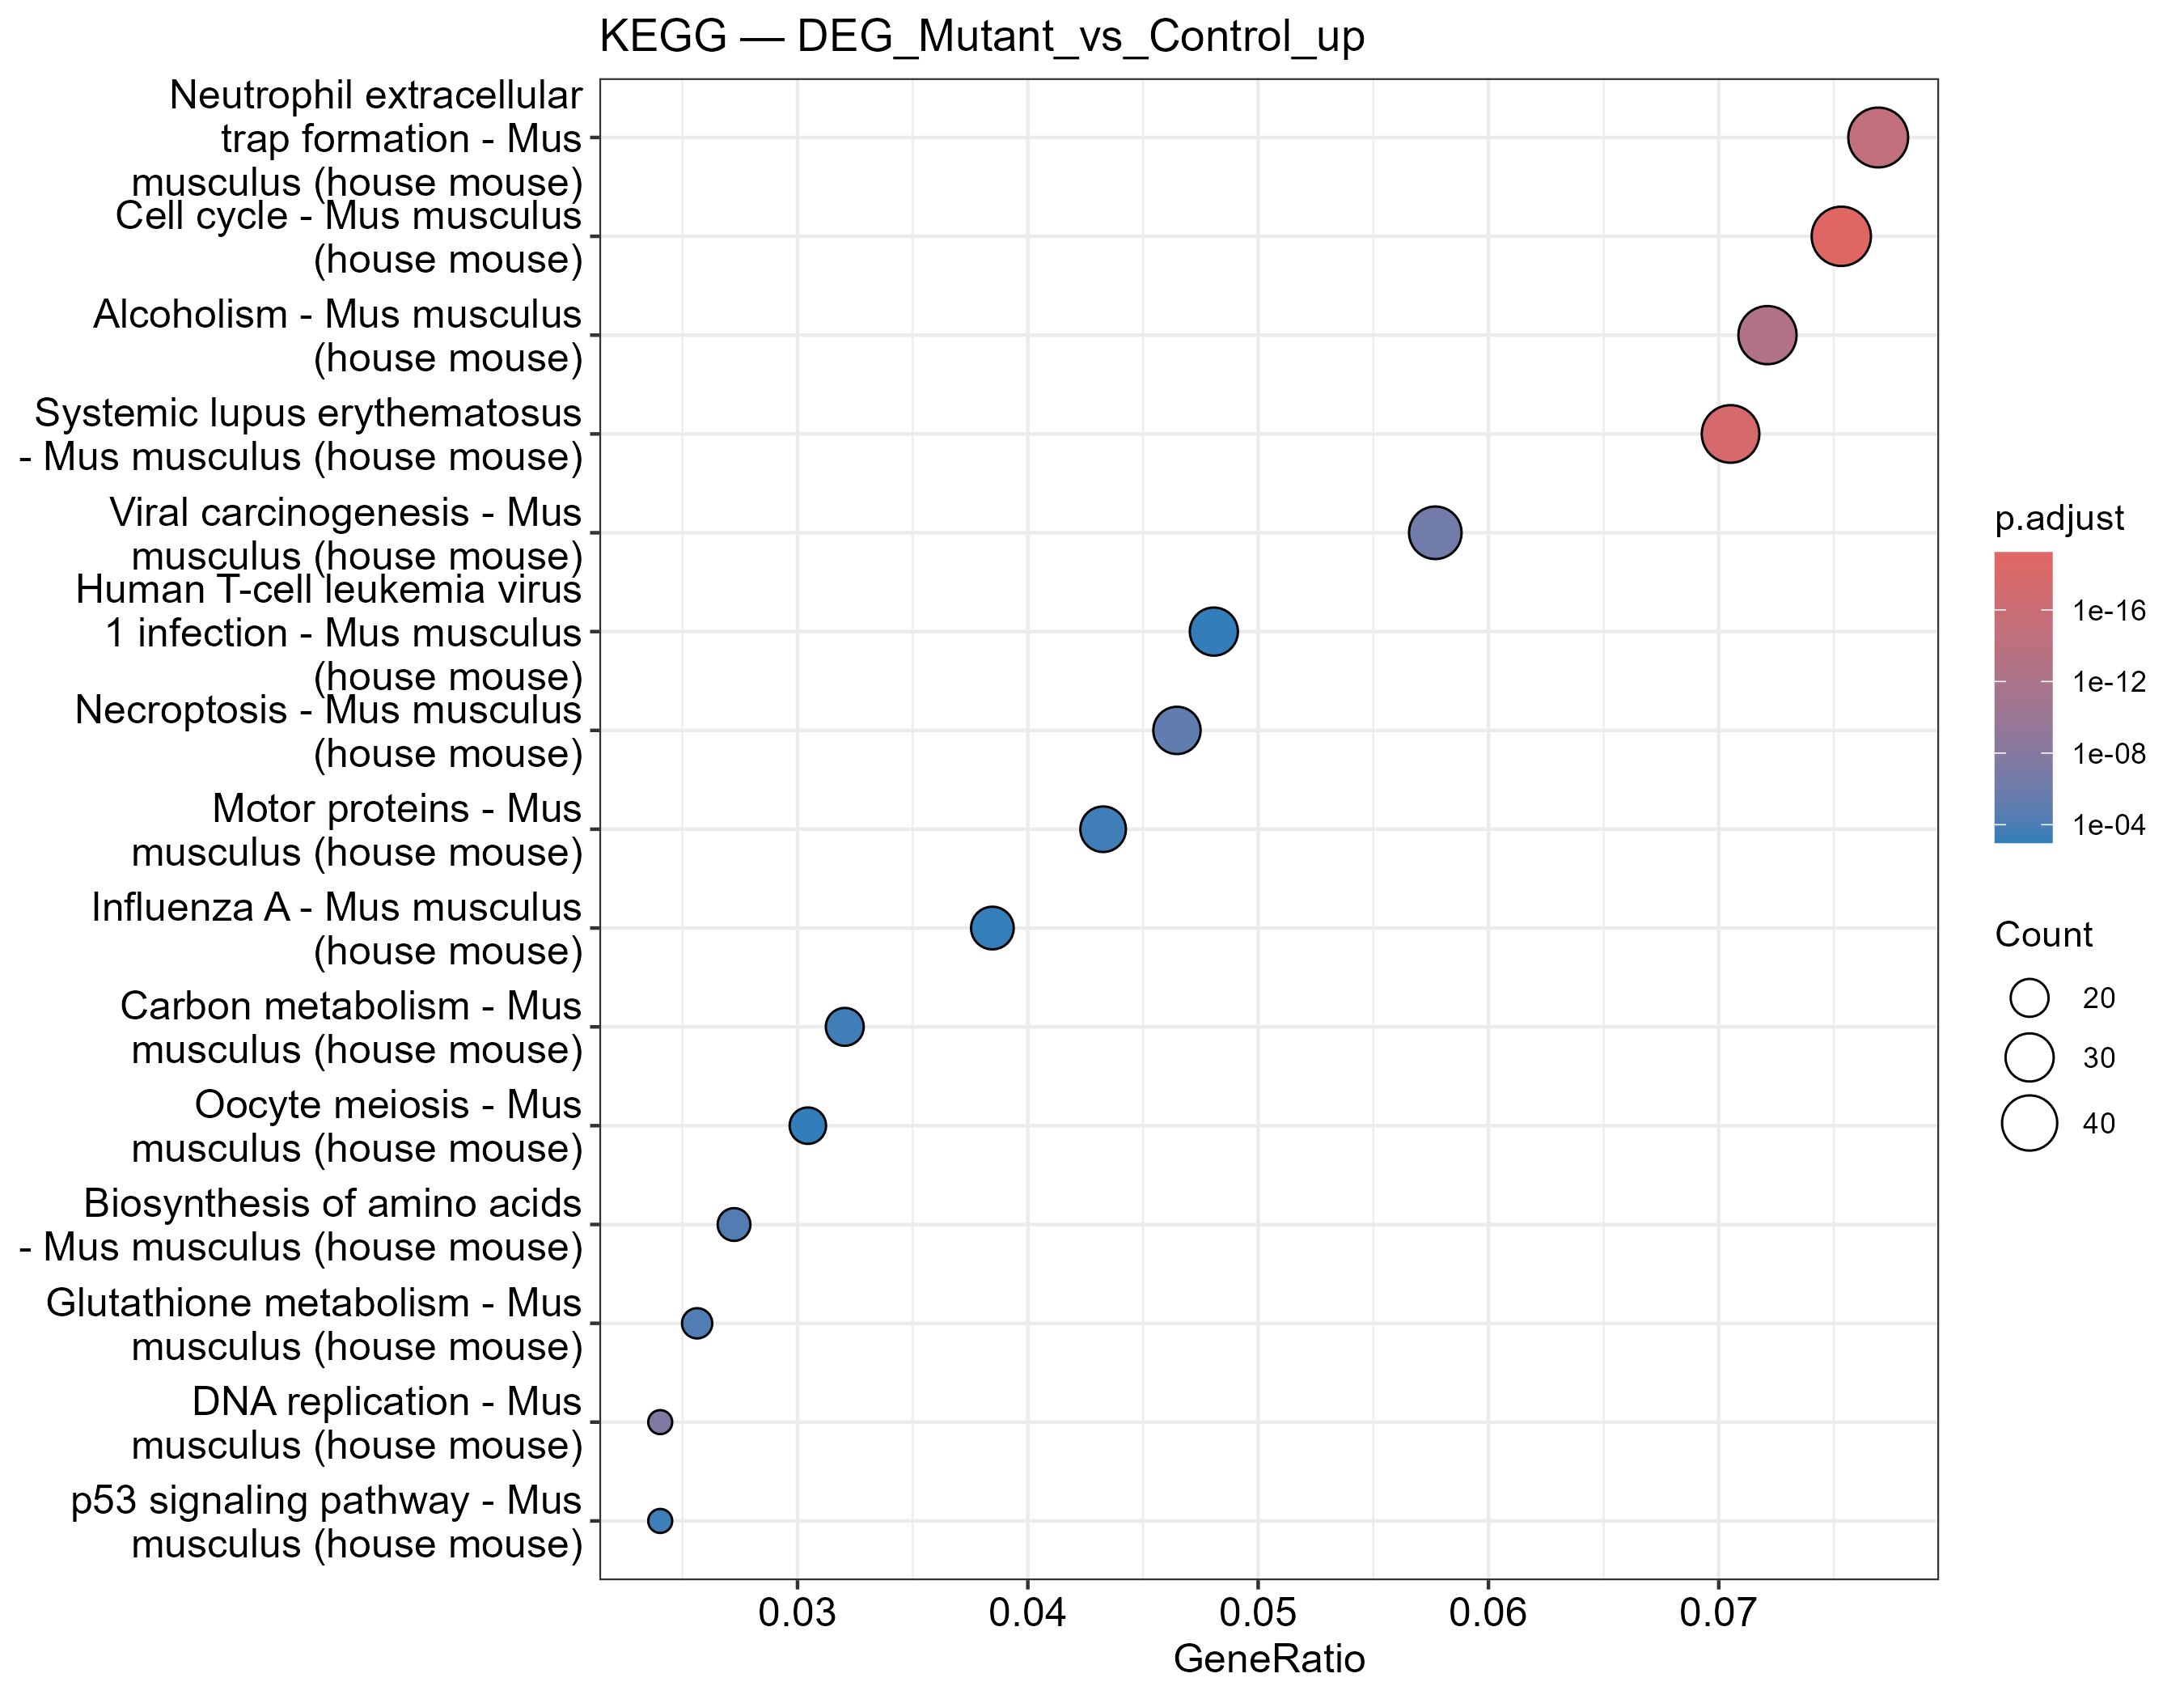
KEGG Enrichment
RNA-seq-enrichment · online-first with local cache fallback.
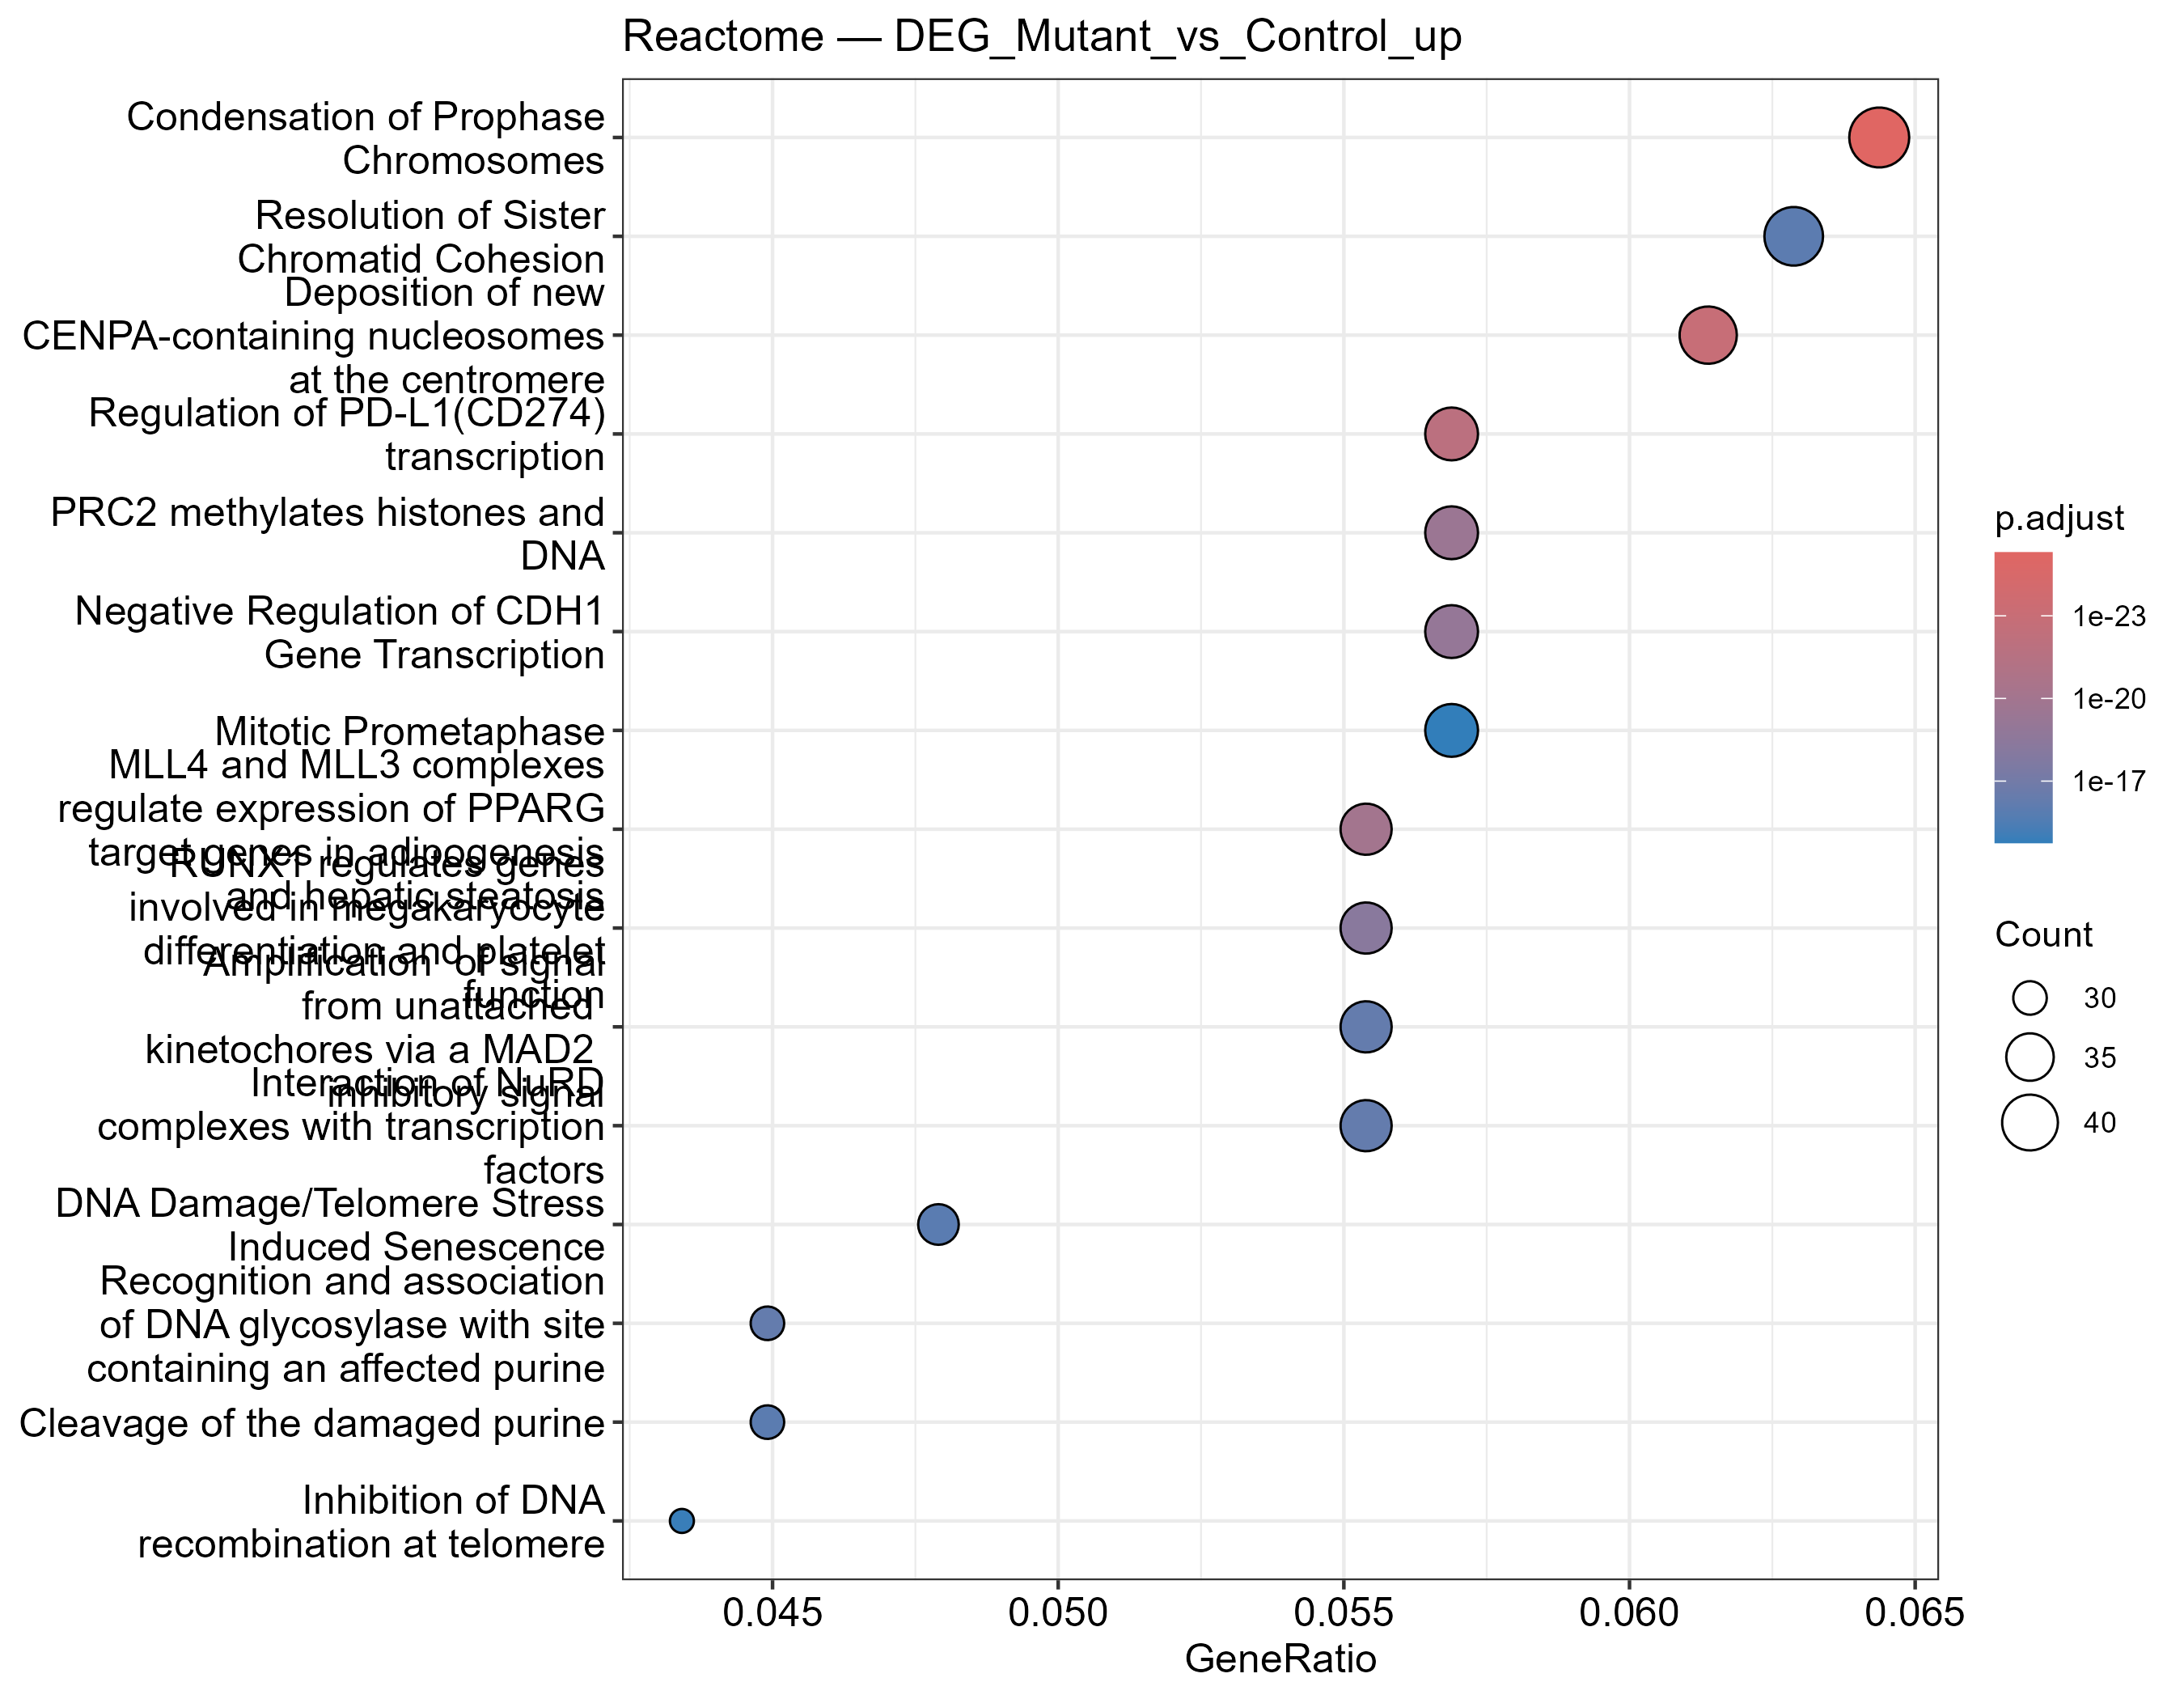
Reactome Enrichment
RNA-seq-enrichment · offline Reactome pathways.
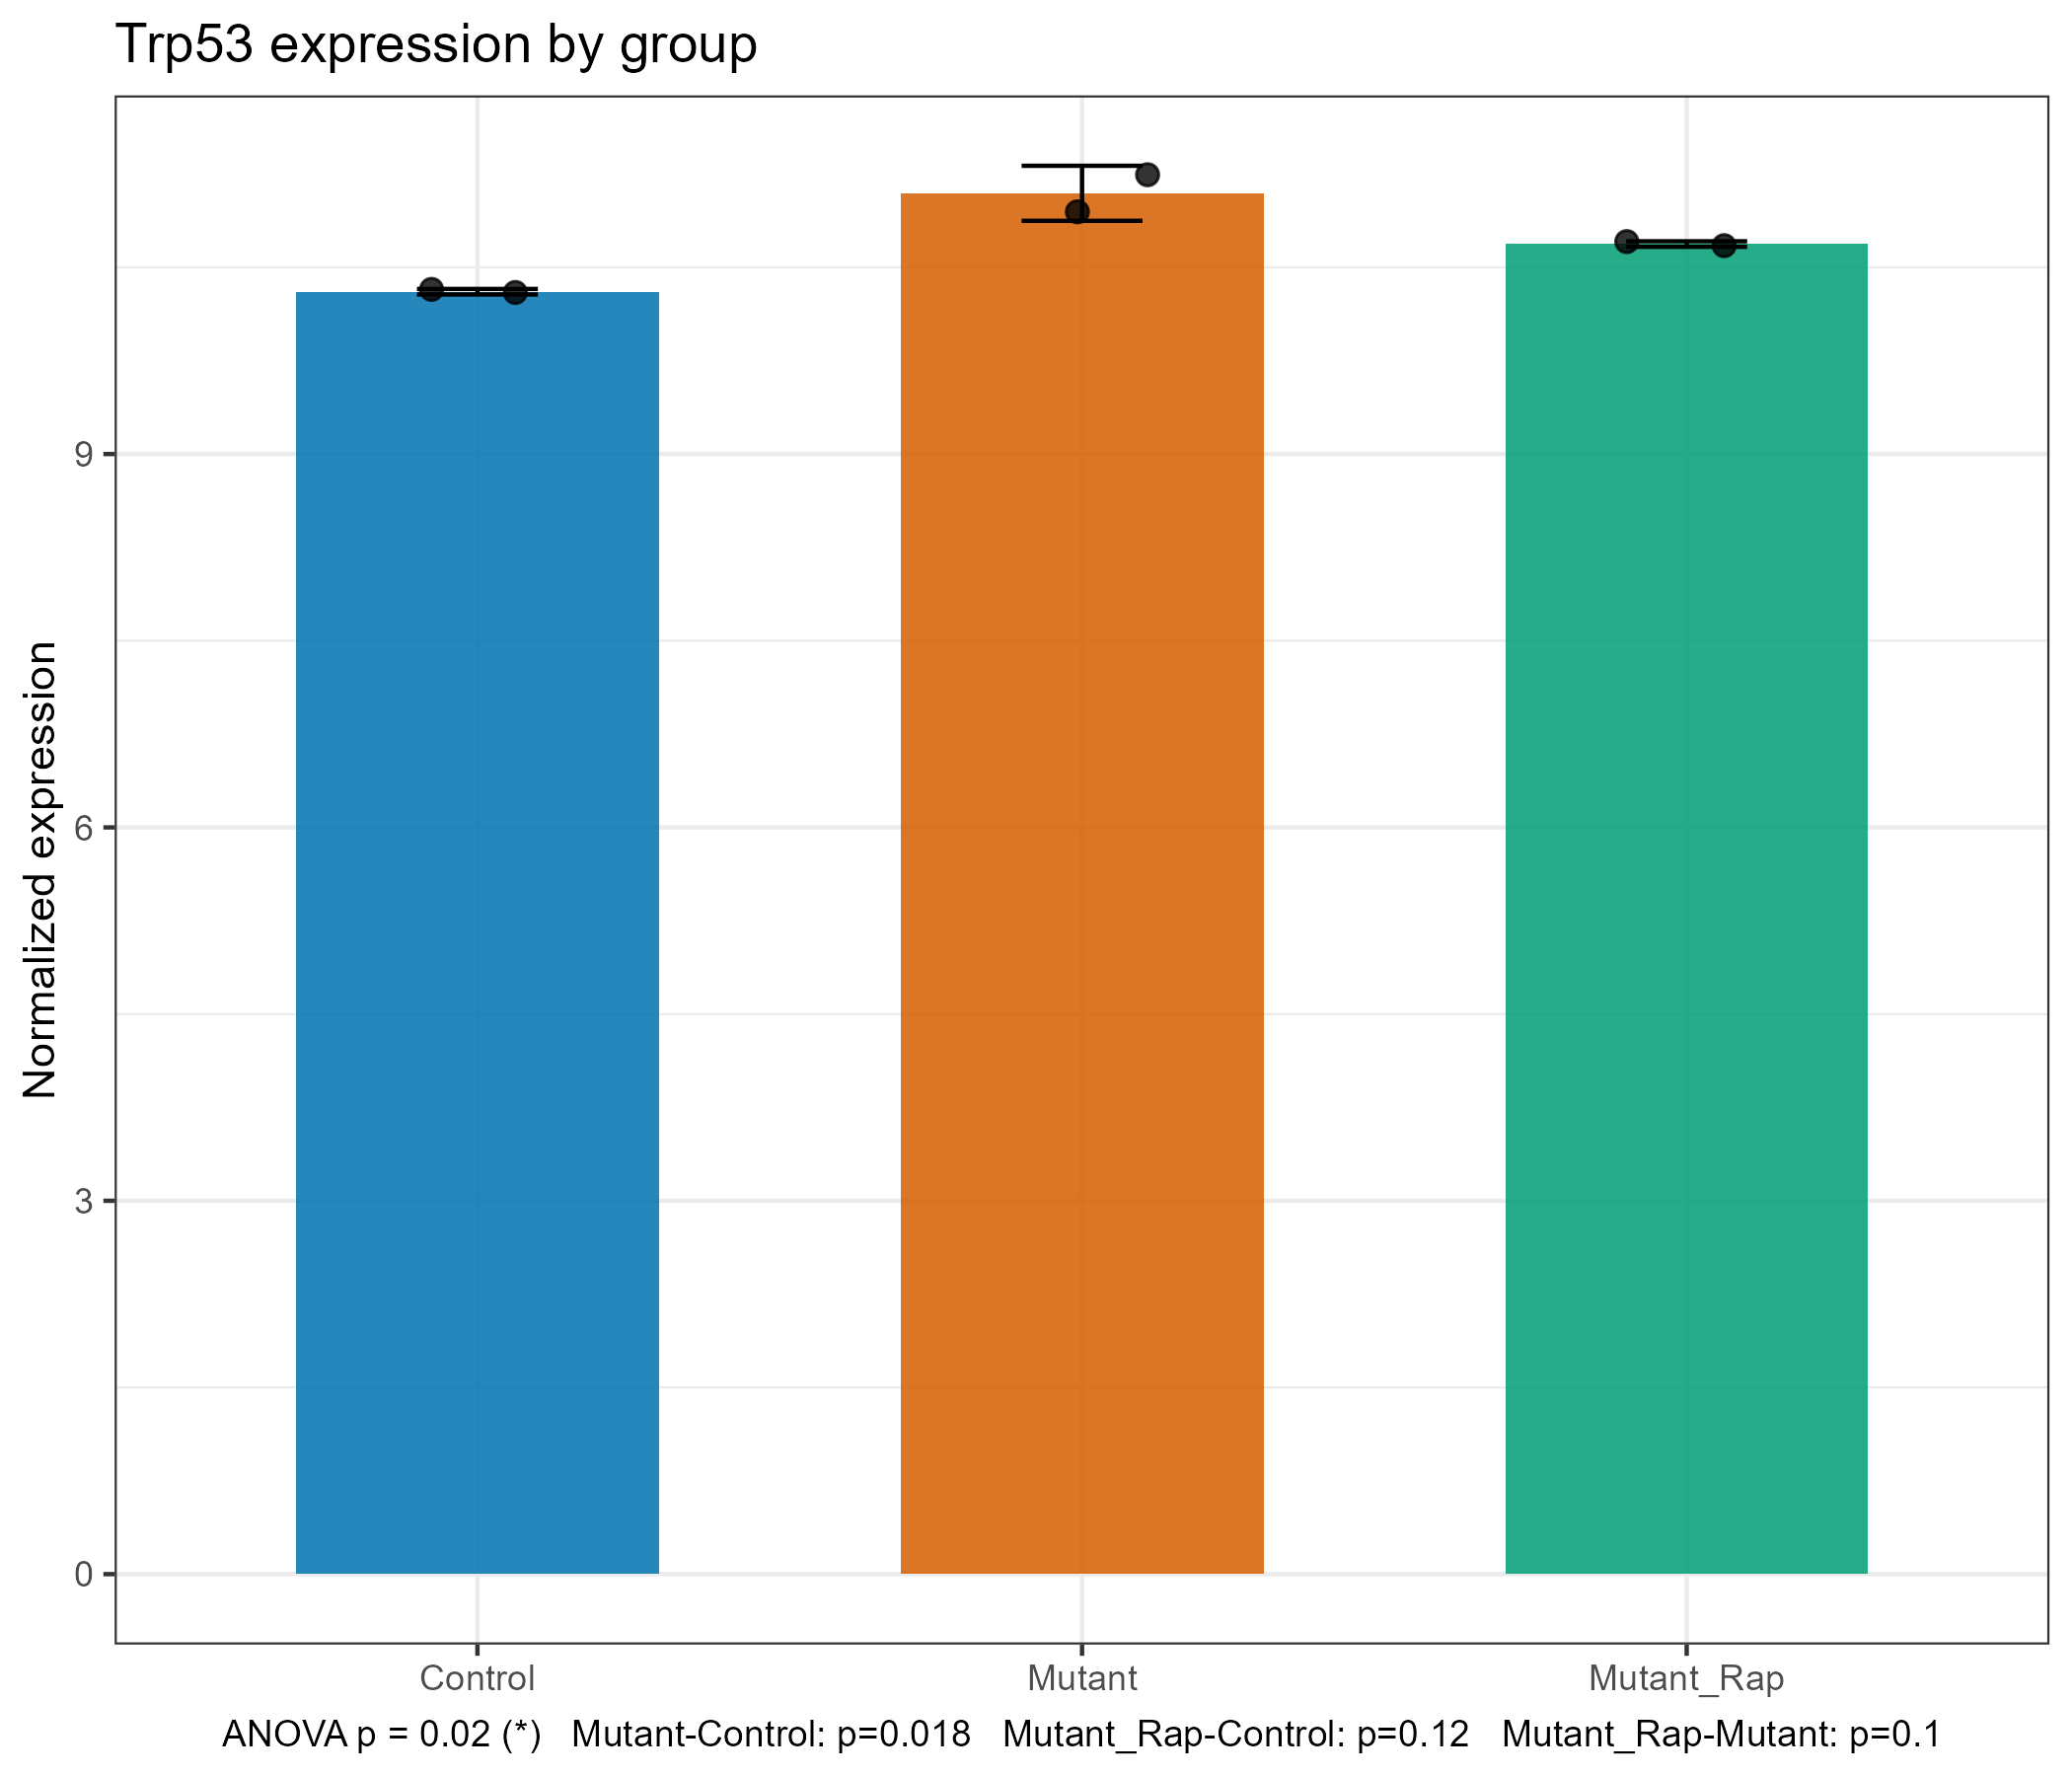
Gene across Groups
RNA-seq-gene-plot · one gene, SD bars + points + t-test/ANOVA+Tukey.
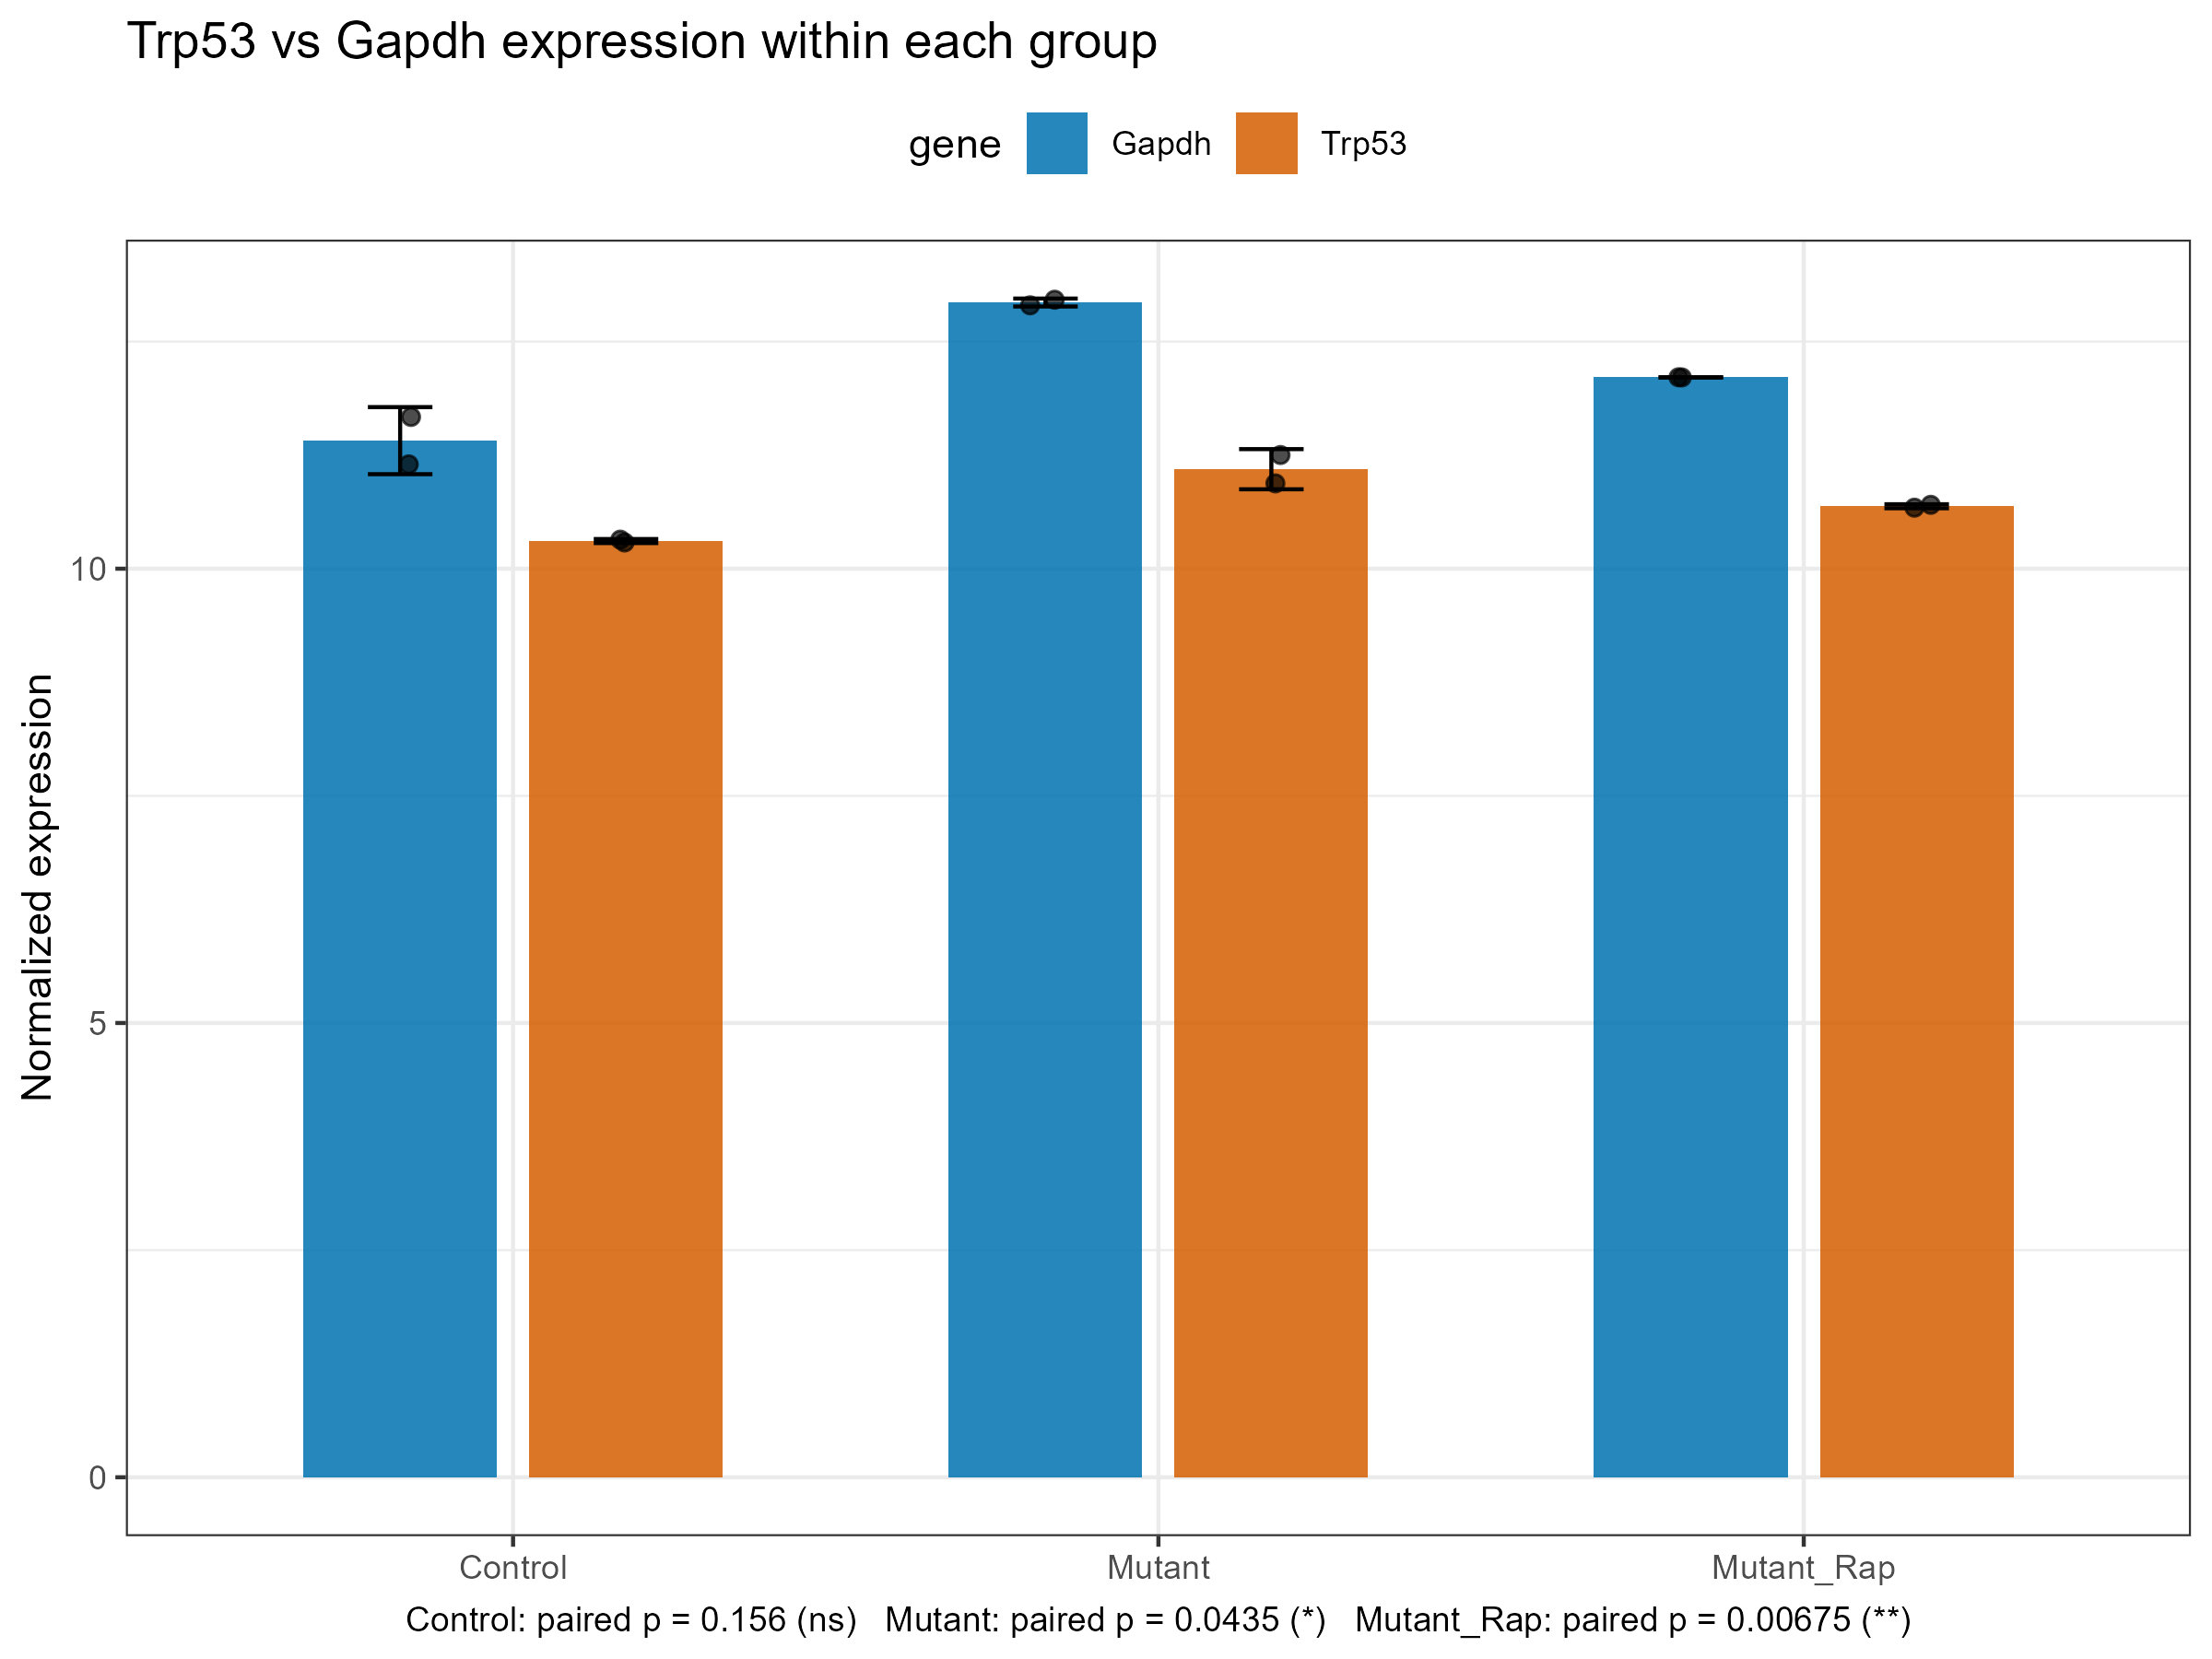
Two Genes, One Group
RNA-seq-gene-plot · paired comparison inside a group.
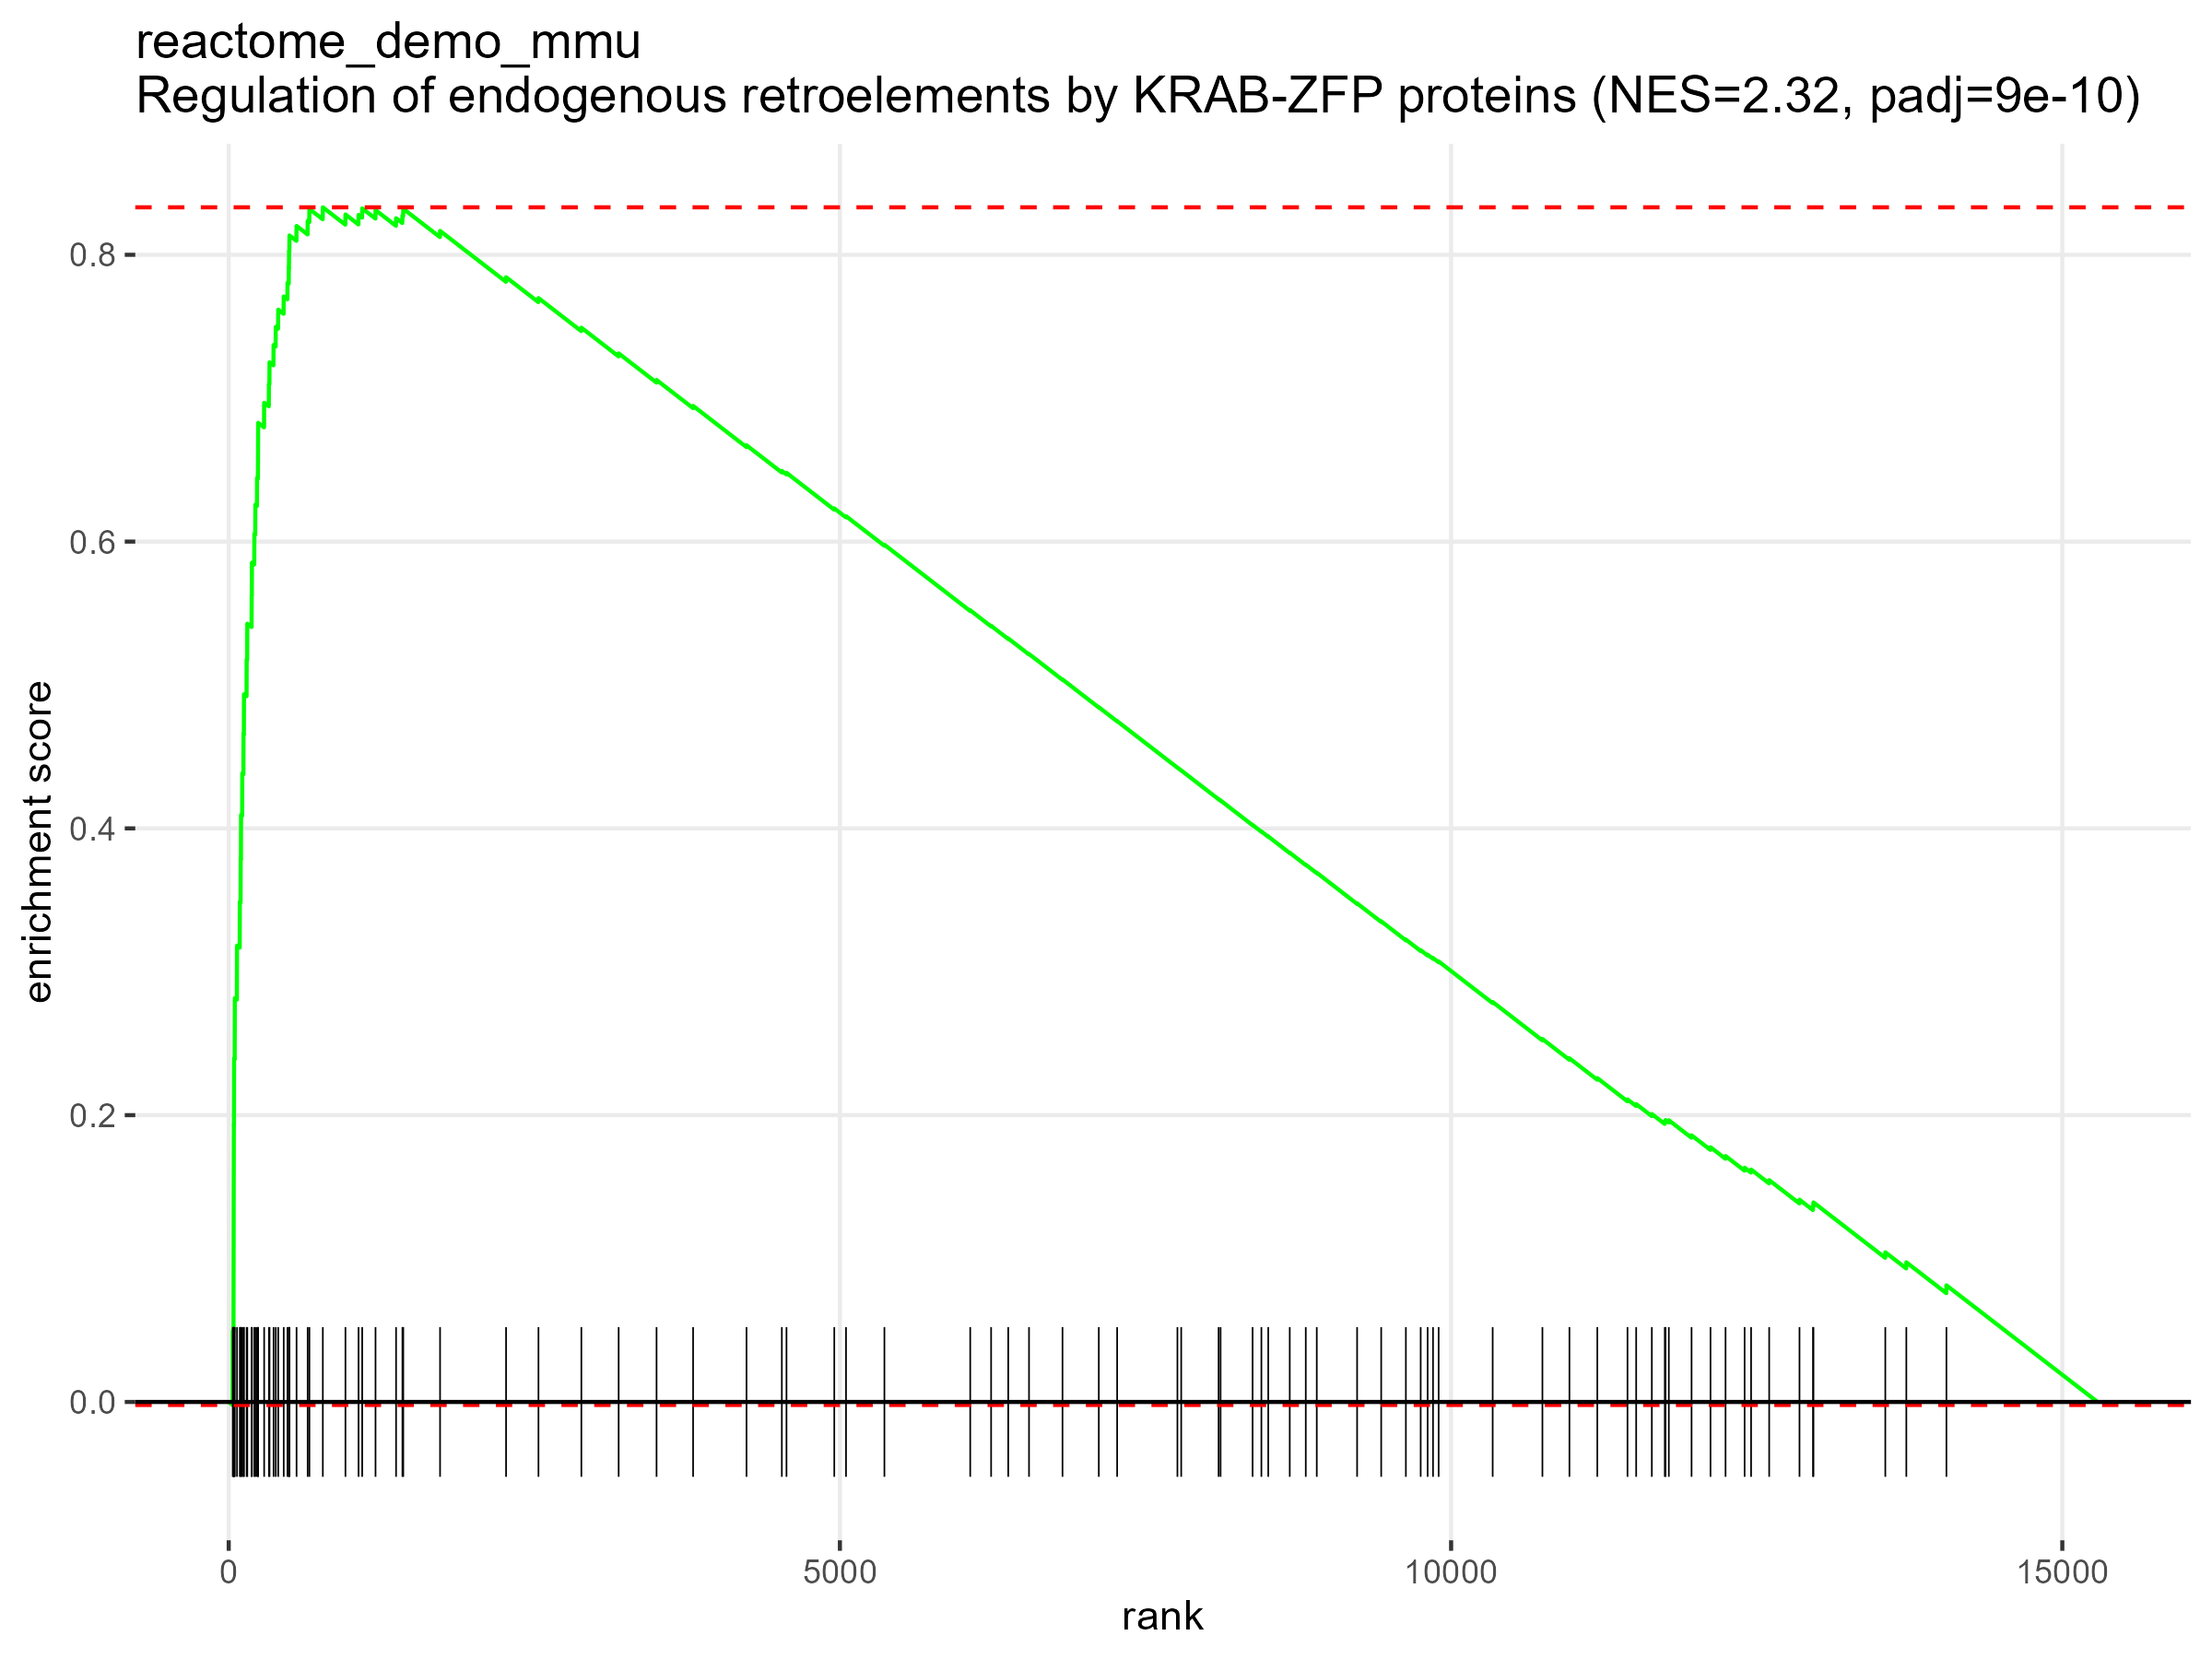
GSEA Curve
RNA-seq-GSEA · fgsea + MSigDB, auto Entrez/symbol conversion.
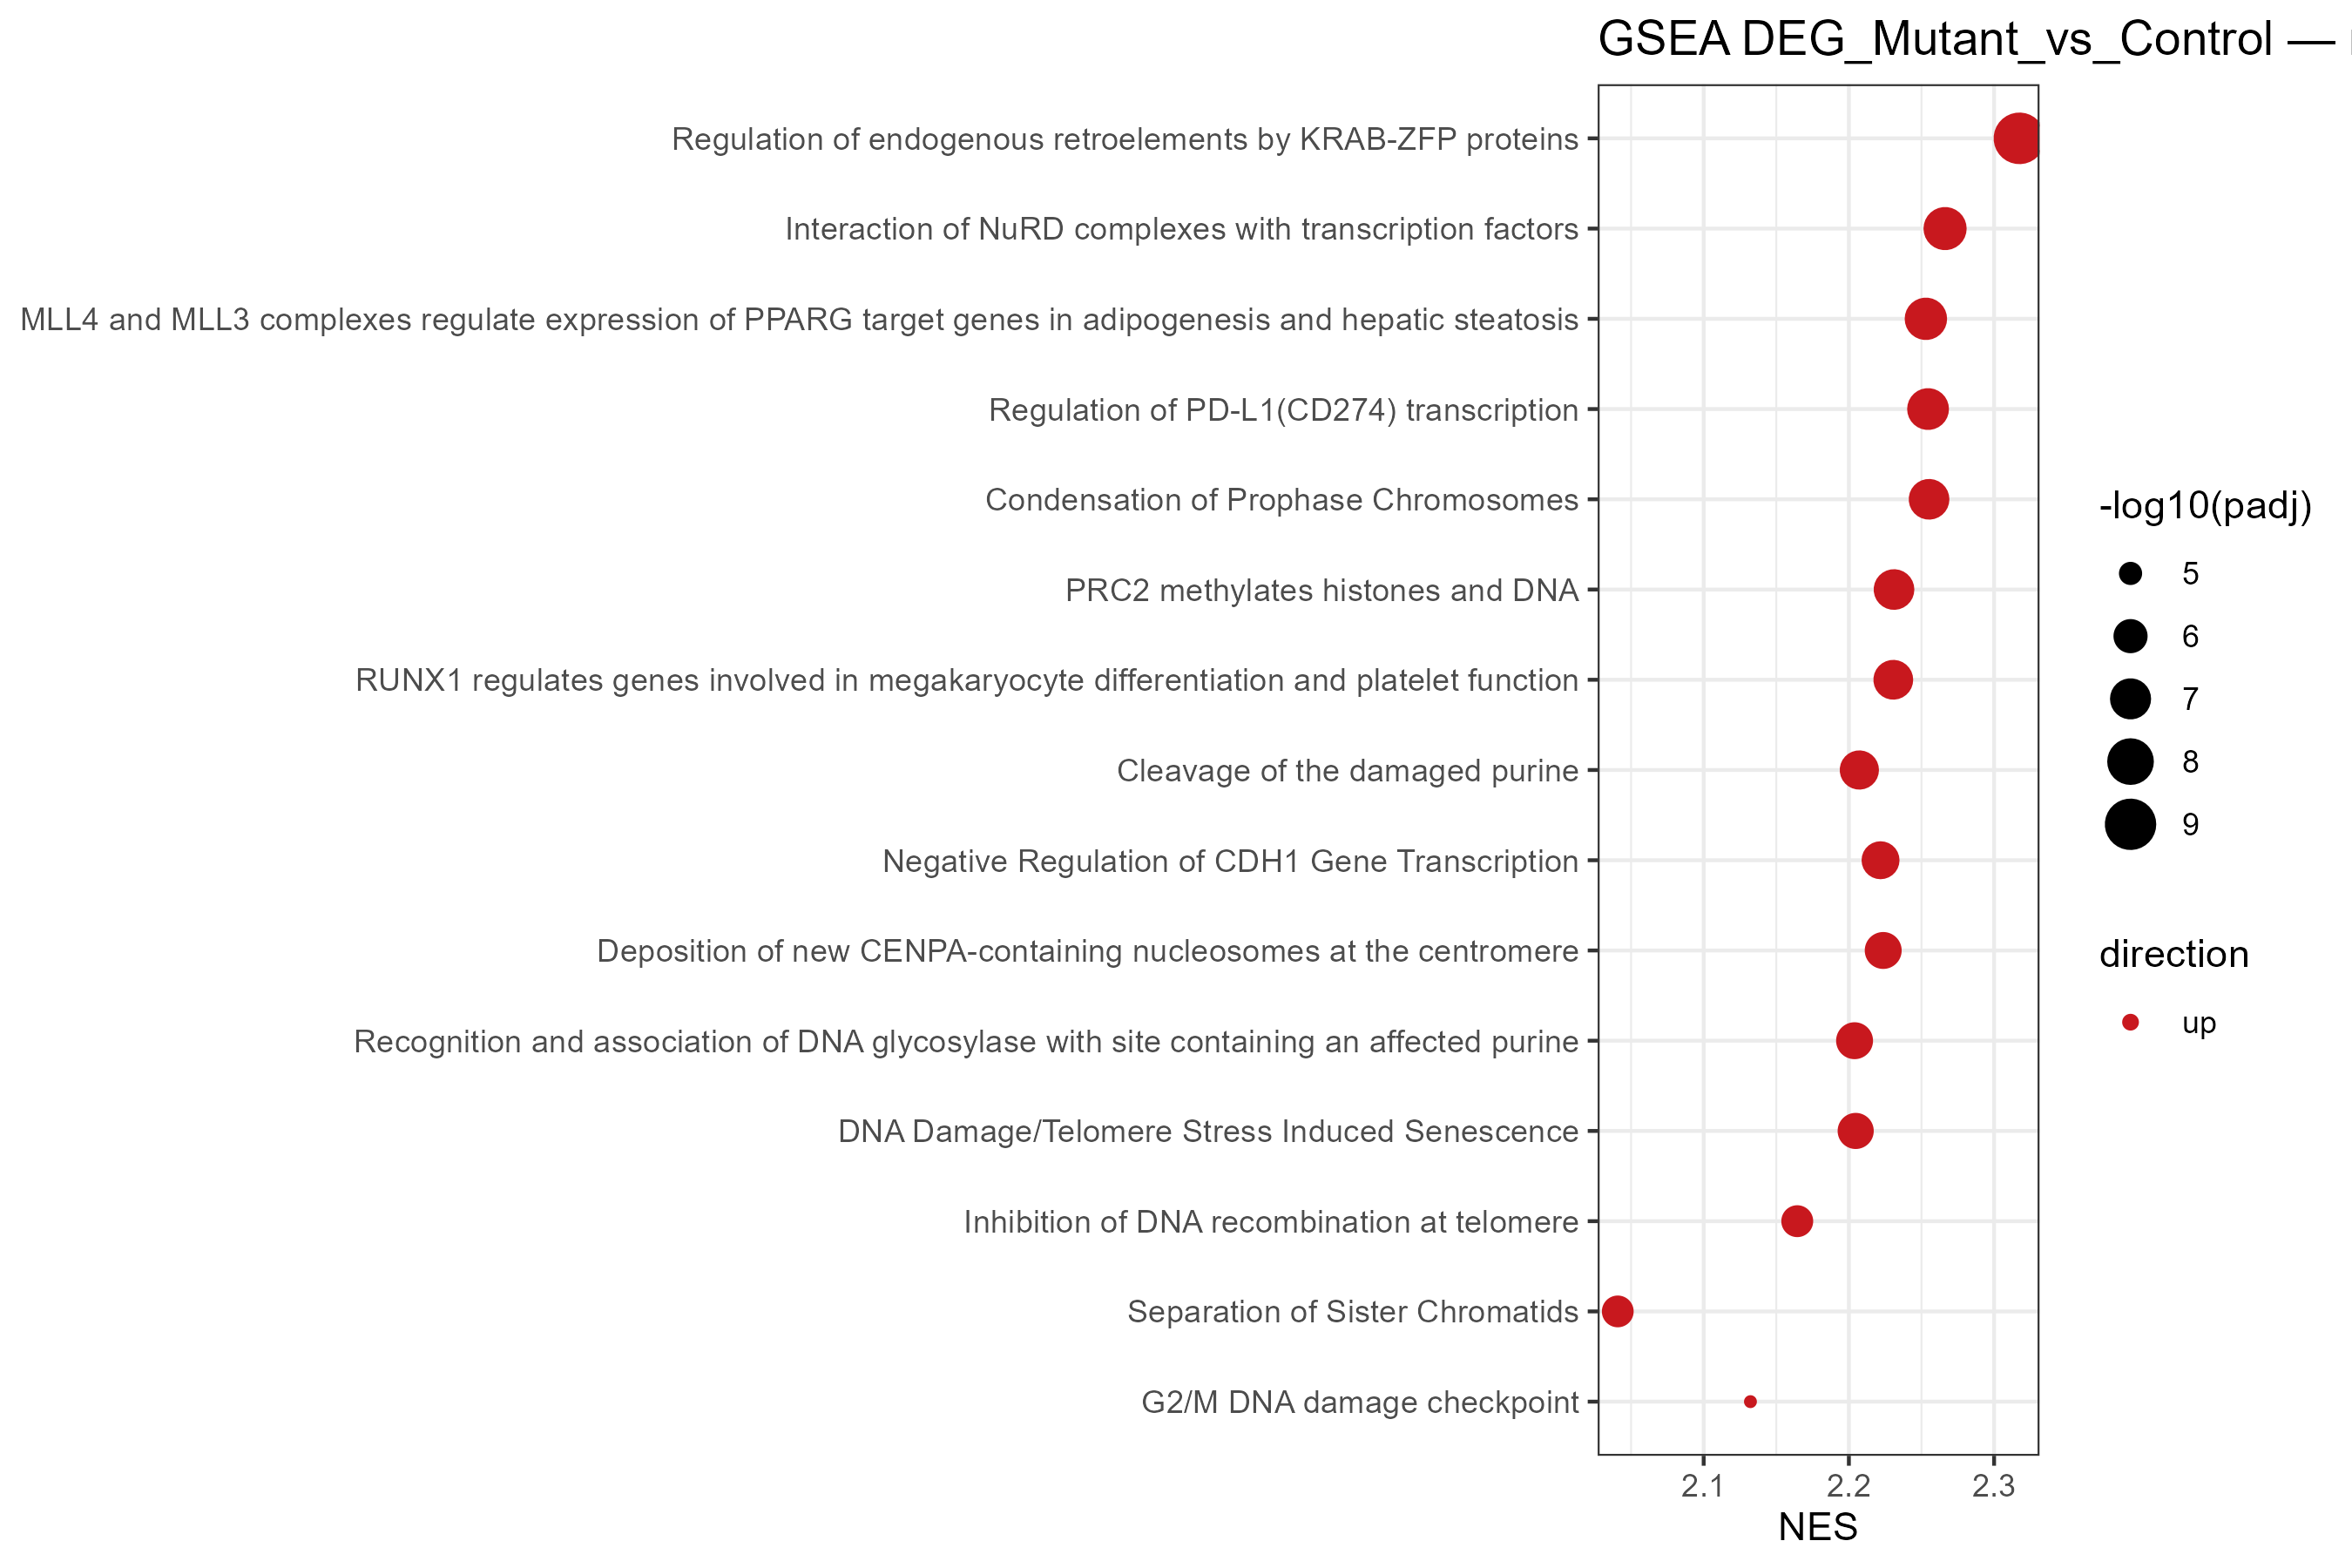
GSEA Dotplot
RNA-seq-GSEA · top enriched sets, NES × FDR.
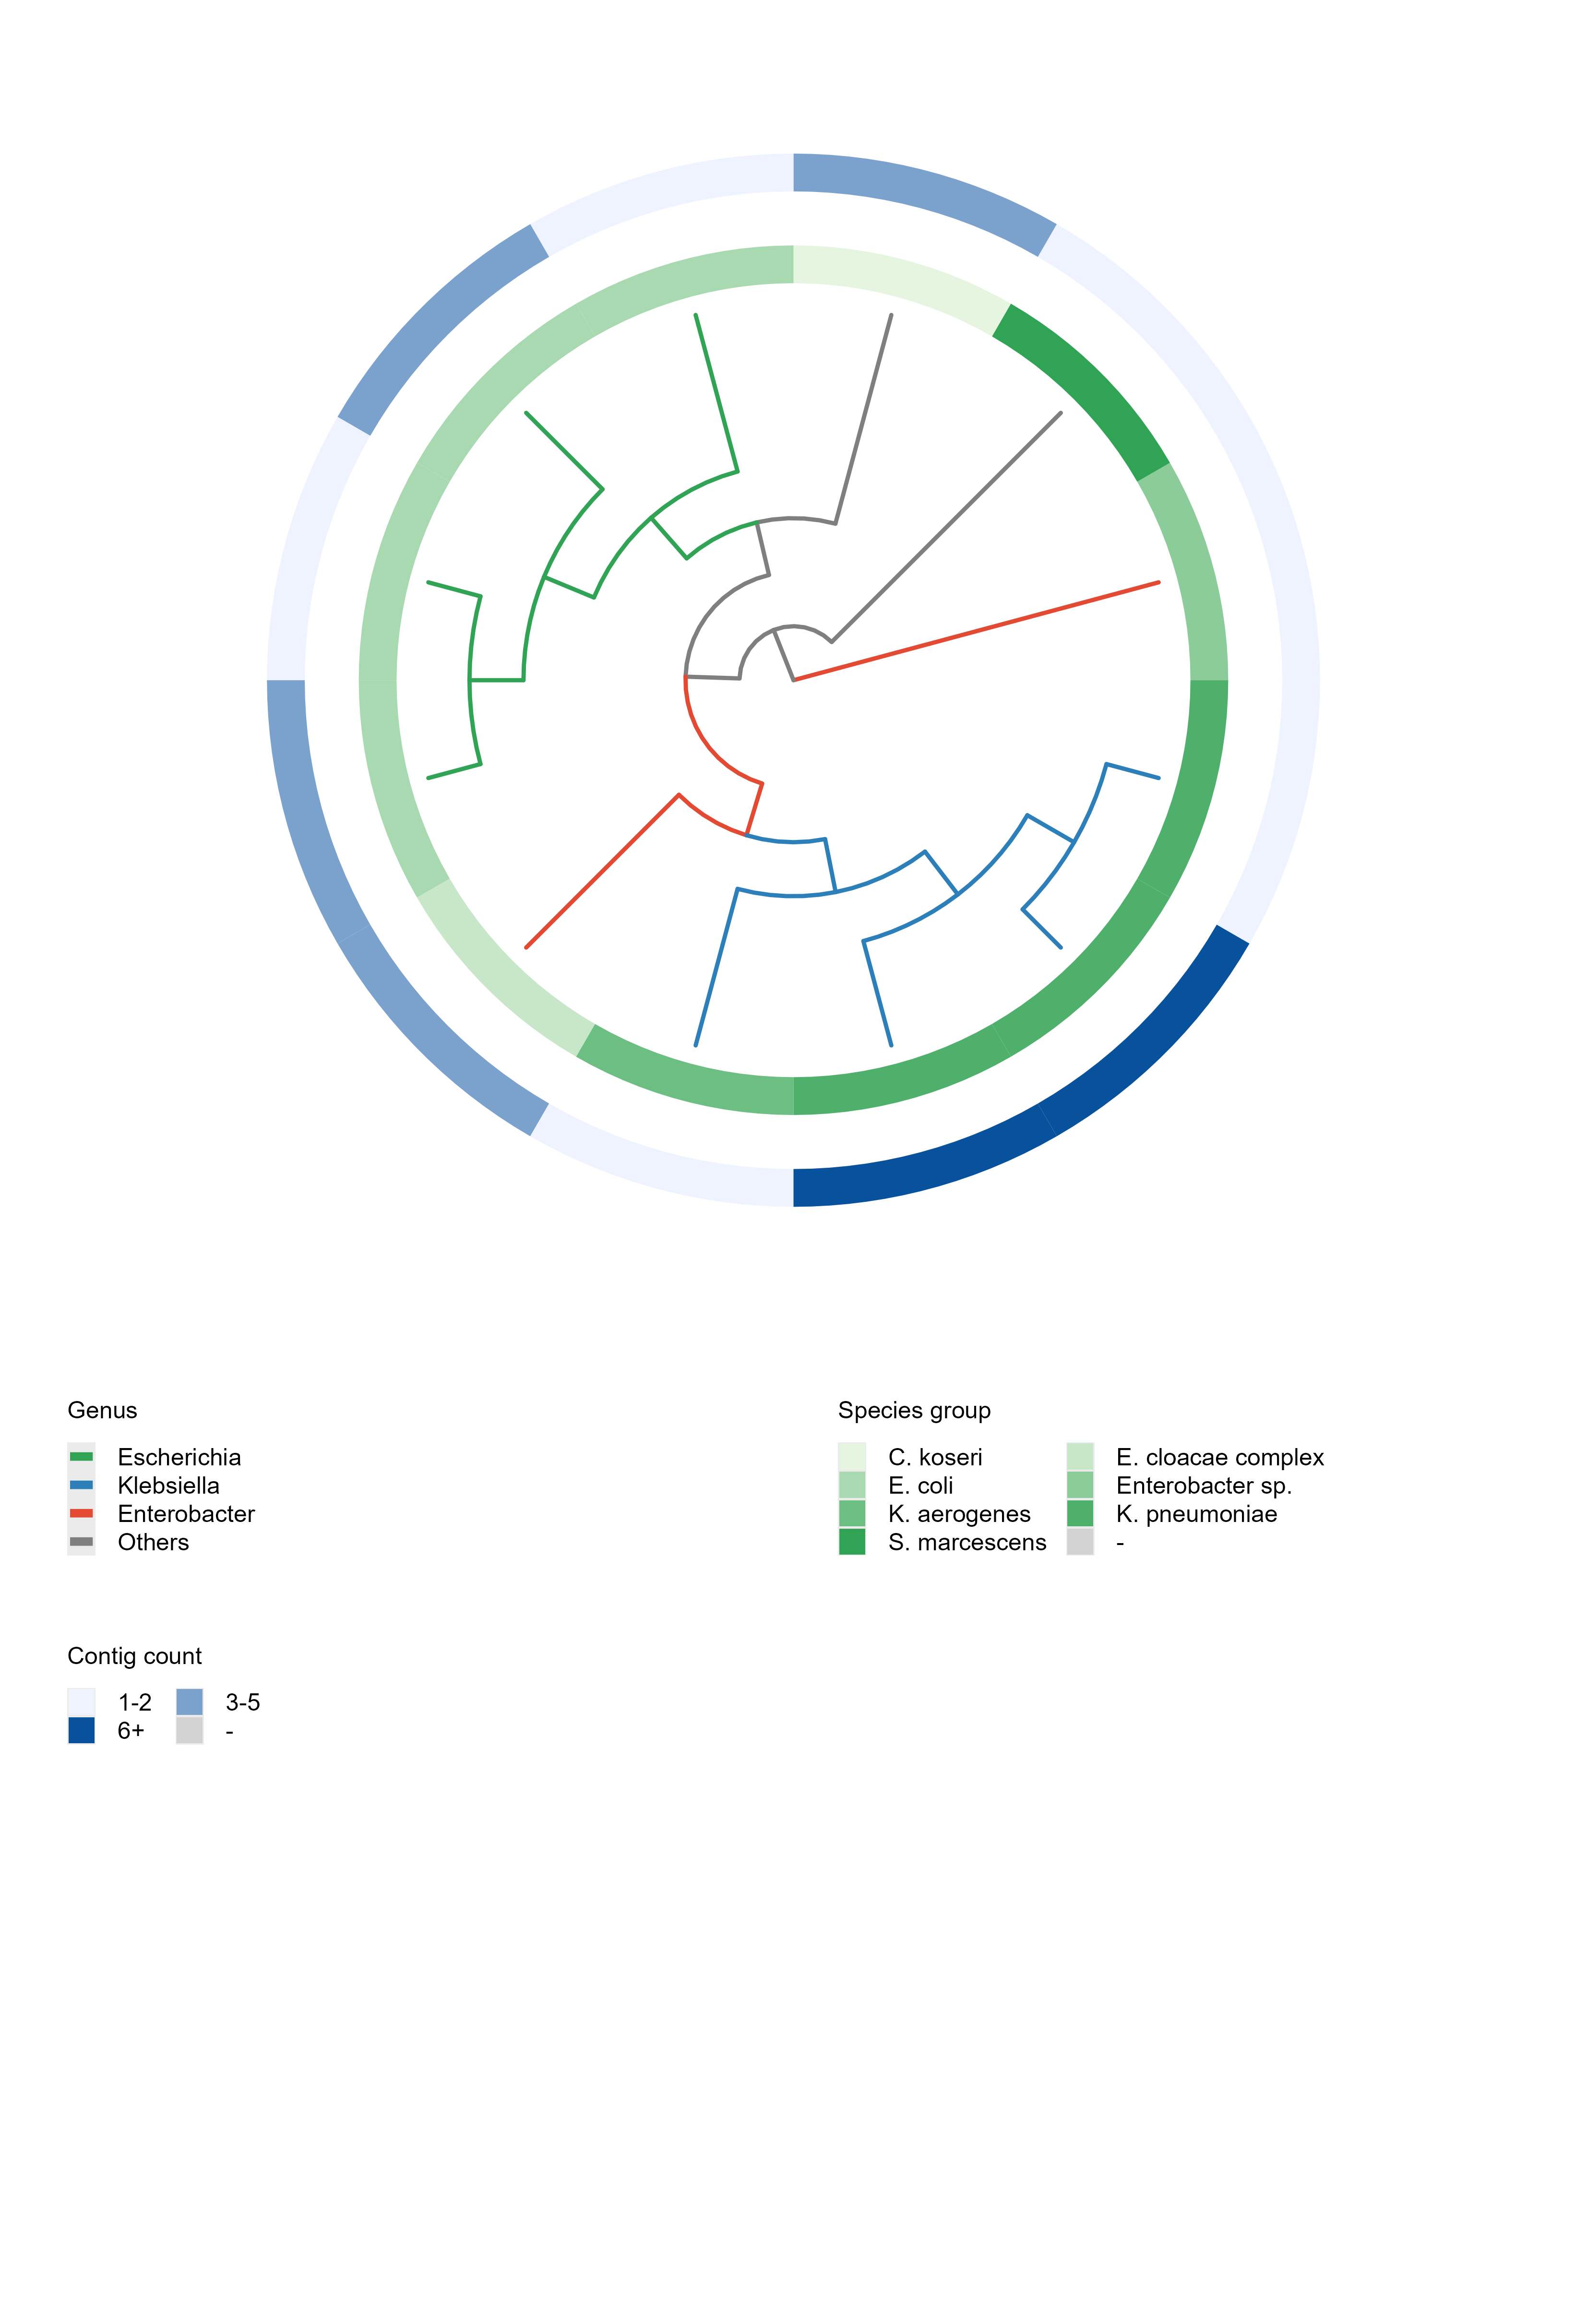
Core-genome Tree — Build
phylo-tree-build · genome FASTAs → bcgTree → IQ-TREE2 ML treefile (WSL2). Figure drawn by phylo-tree-plot from this skill's treefile.
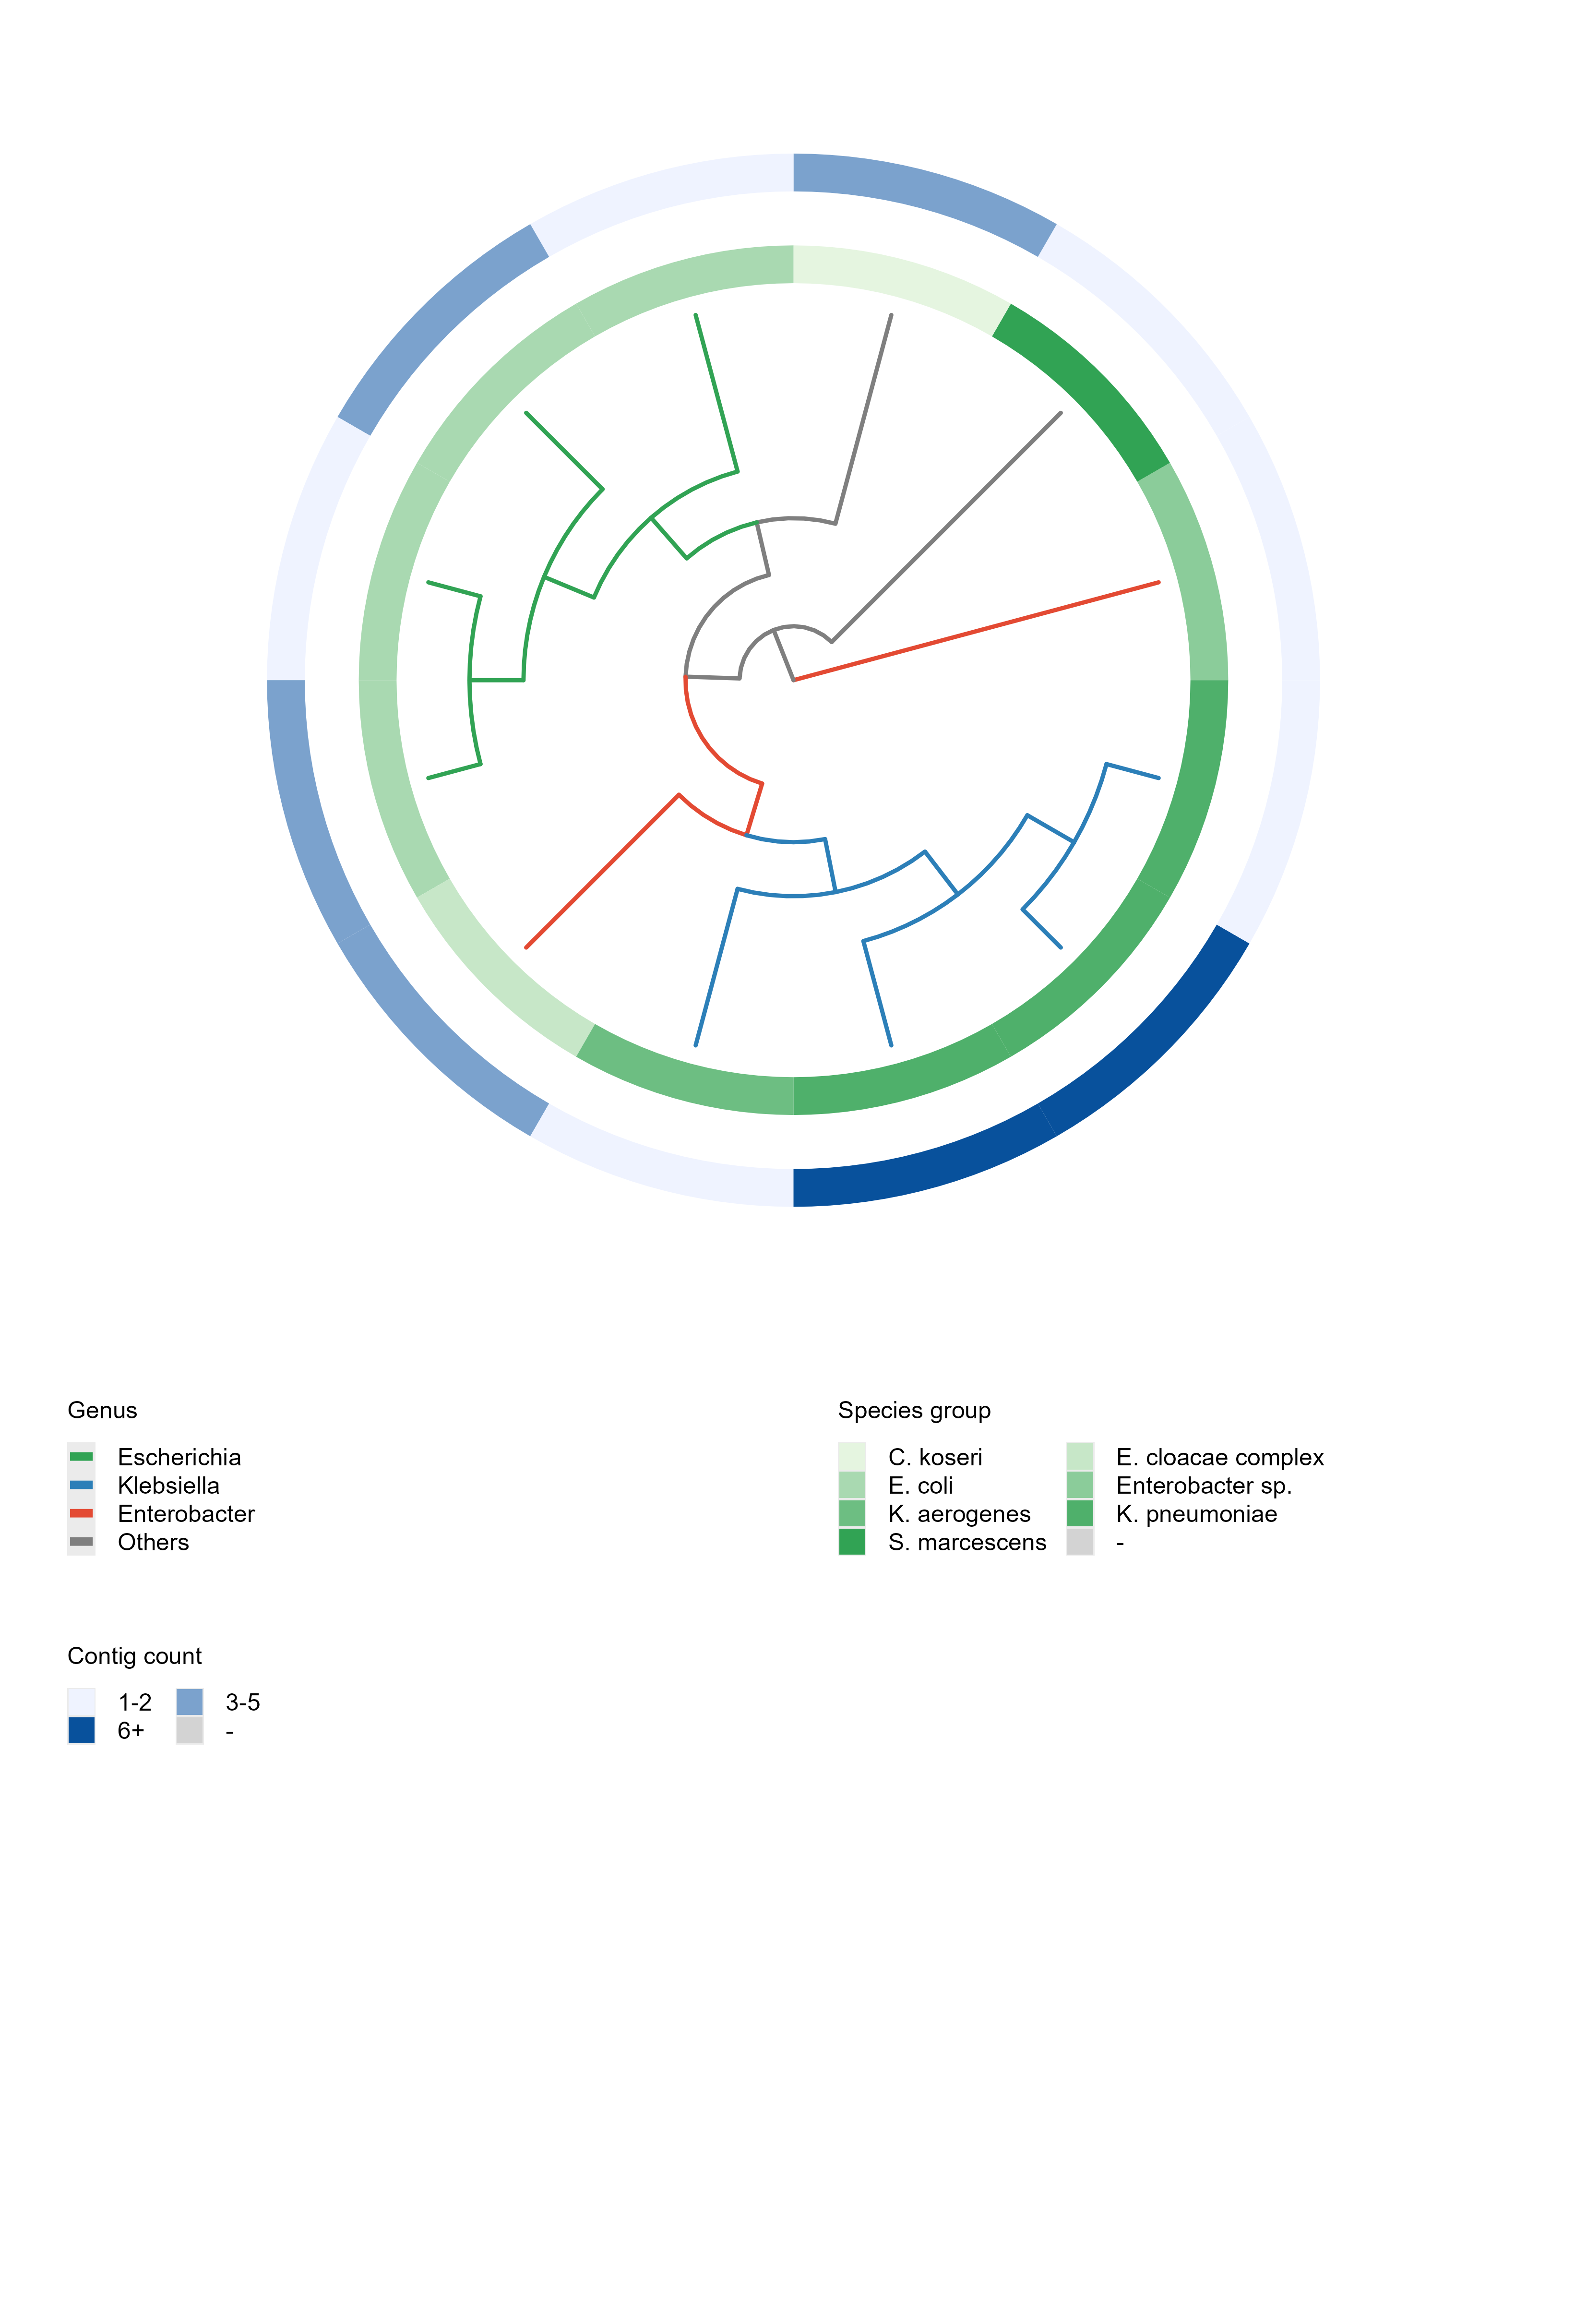
Core-genome Tree — Plot
phylo-tree-plot · treefile + annotation CSV → publication-ready ggtree figure.
Publication-ready plots and statistical tables — real outputs, no mock-ups.
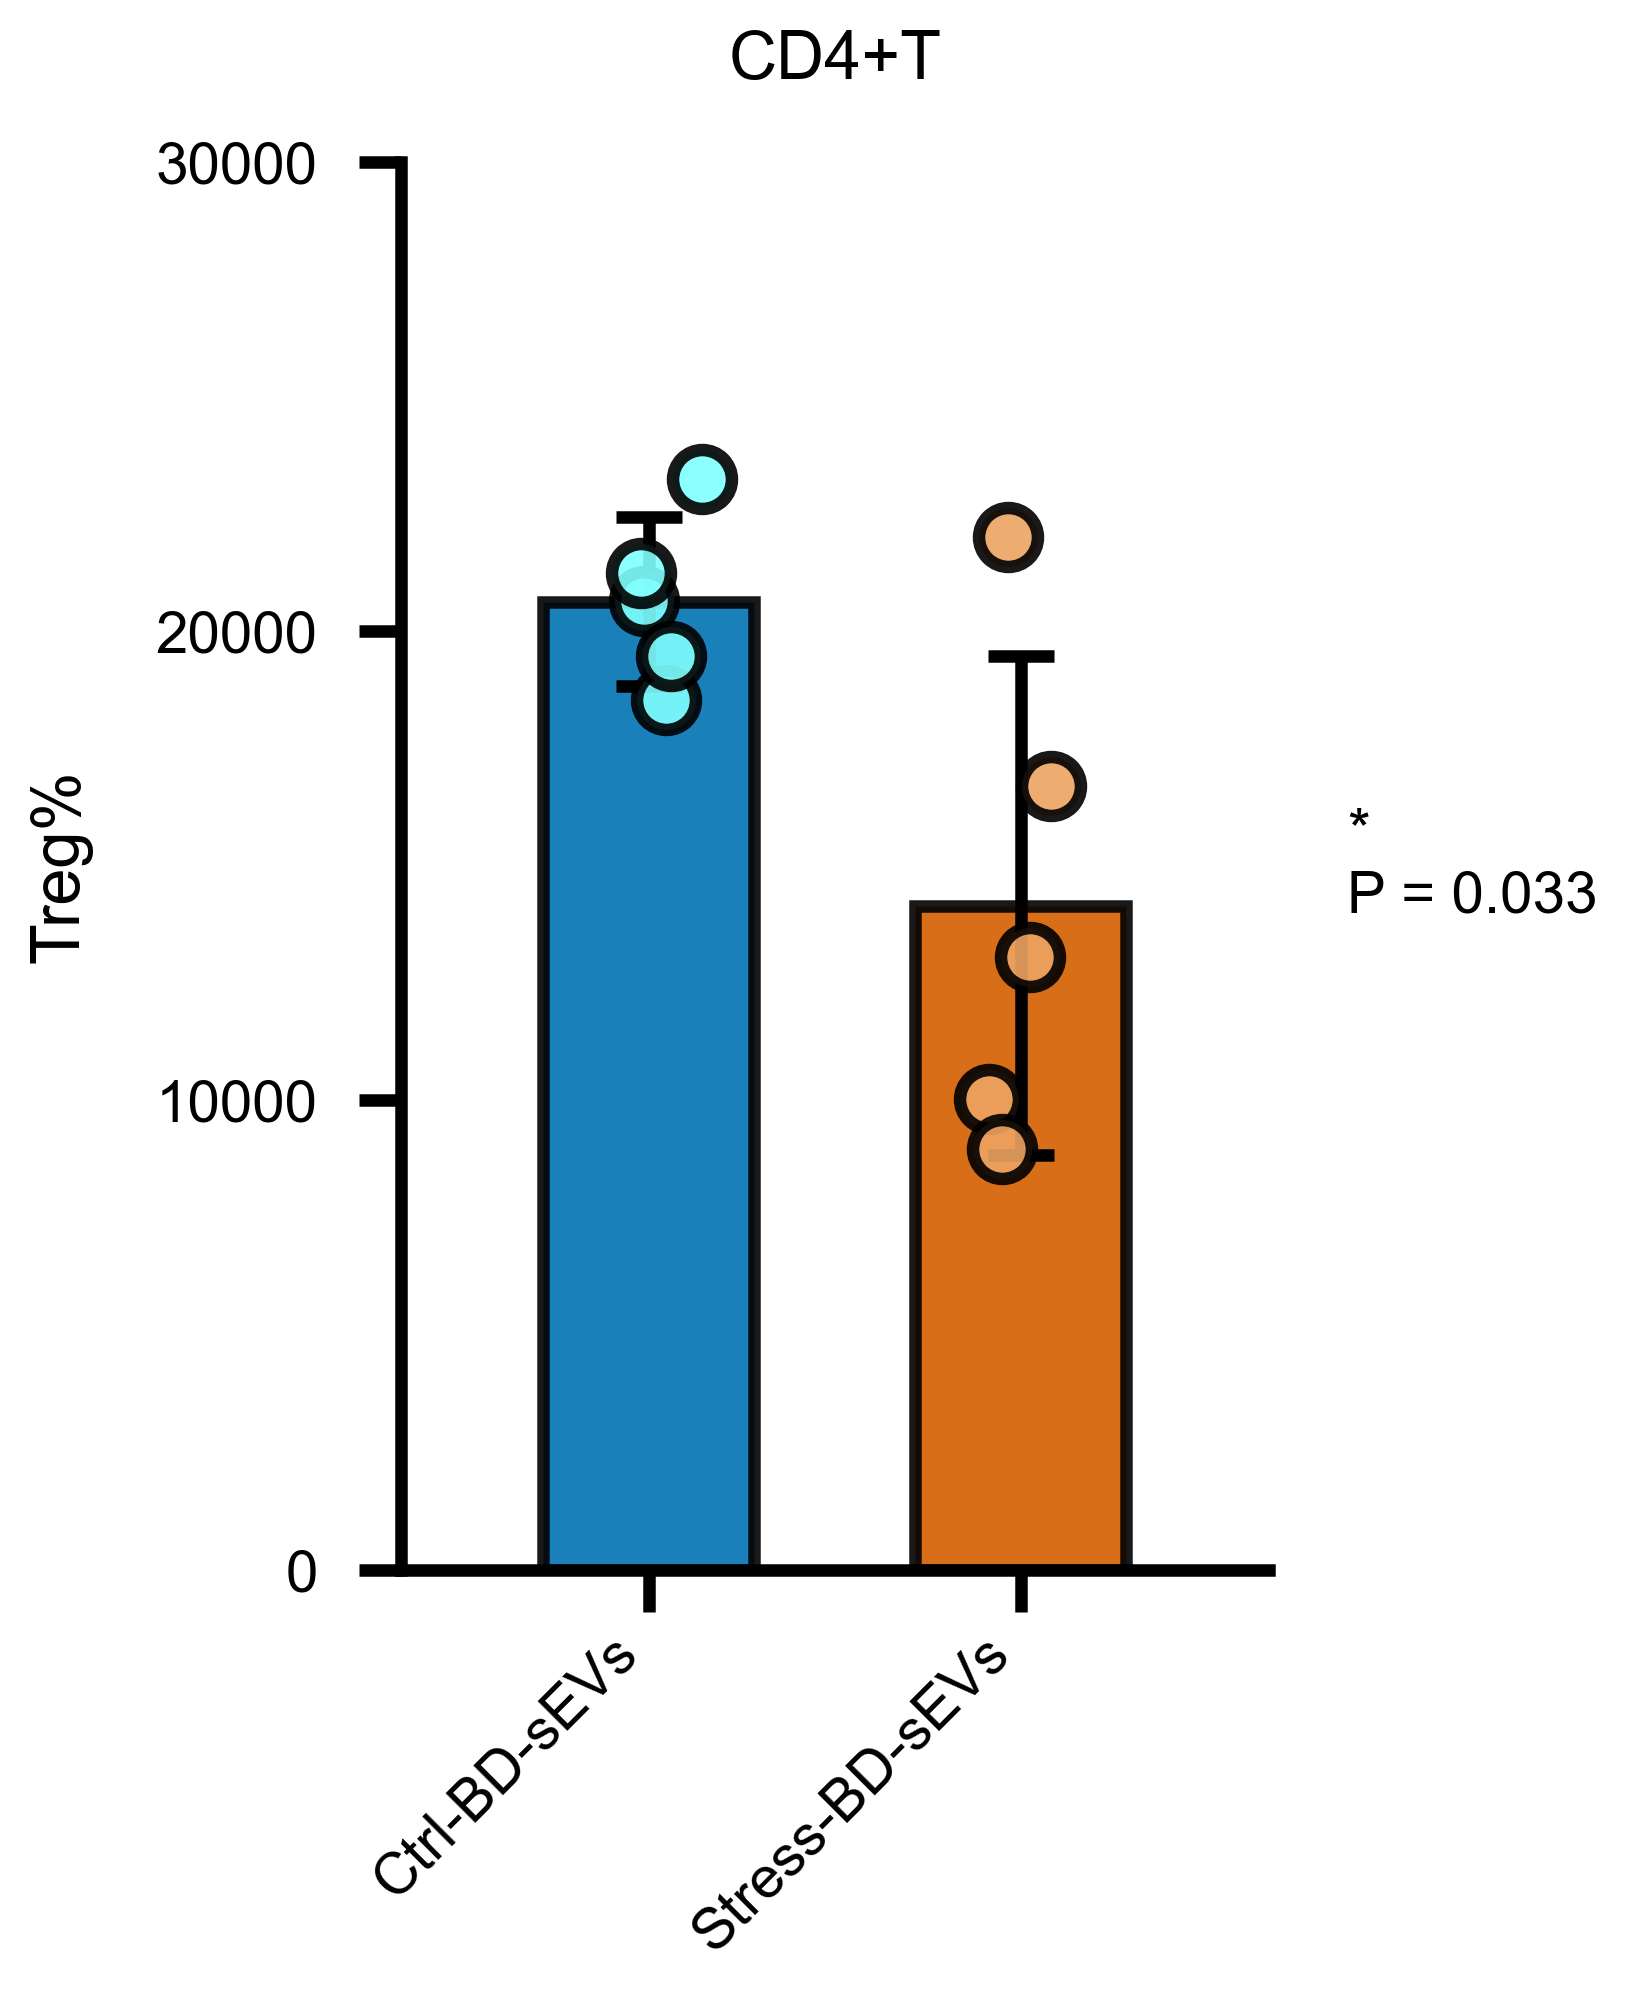
Grouped Bar Plot
barplot · wide-format CSV in, 300-dpi plot with error bars, scatter, P values out.
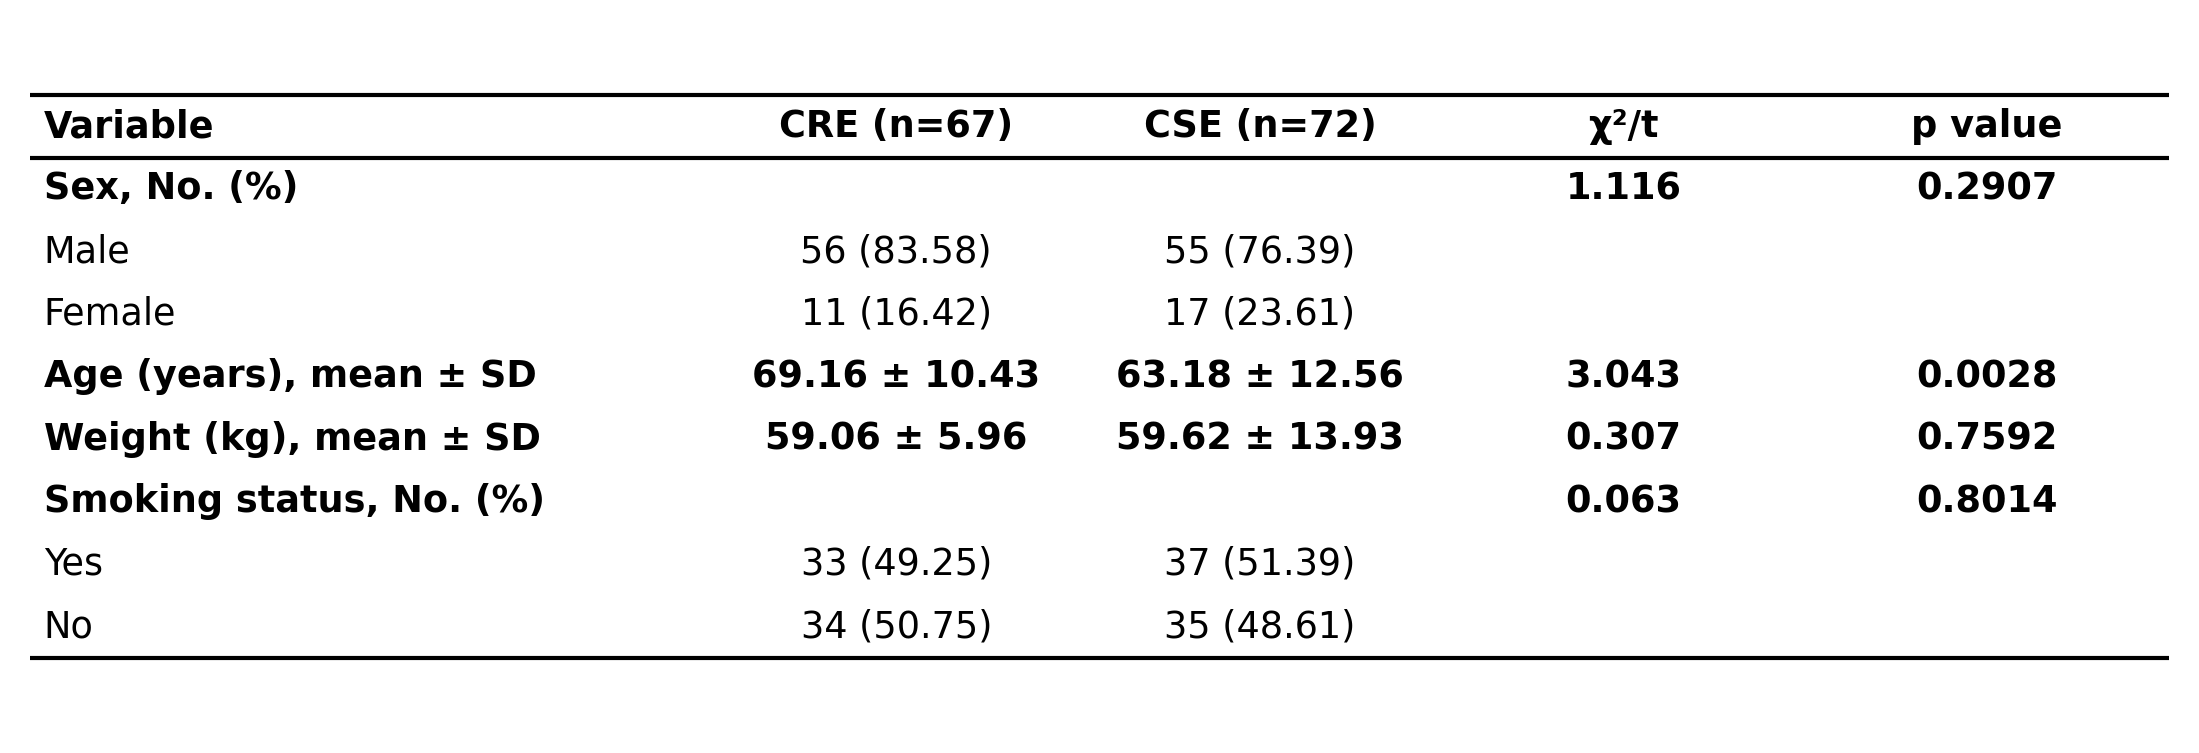
Clinical Three-line Tables
clinical-table · one pipeline reproducing all 10 tables of a paper (baseline / Firth / genotype cross-tabs / univariate) — showcased on a real cohort study.
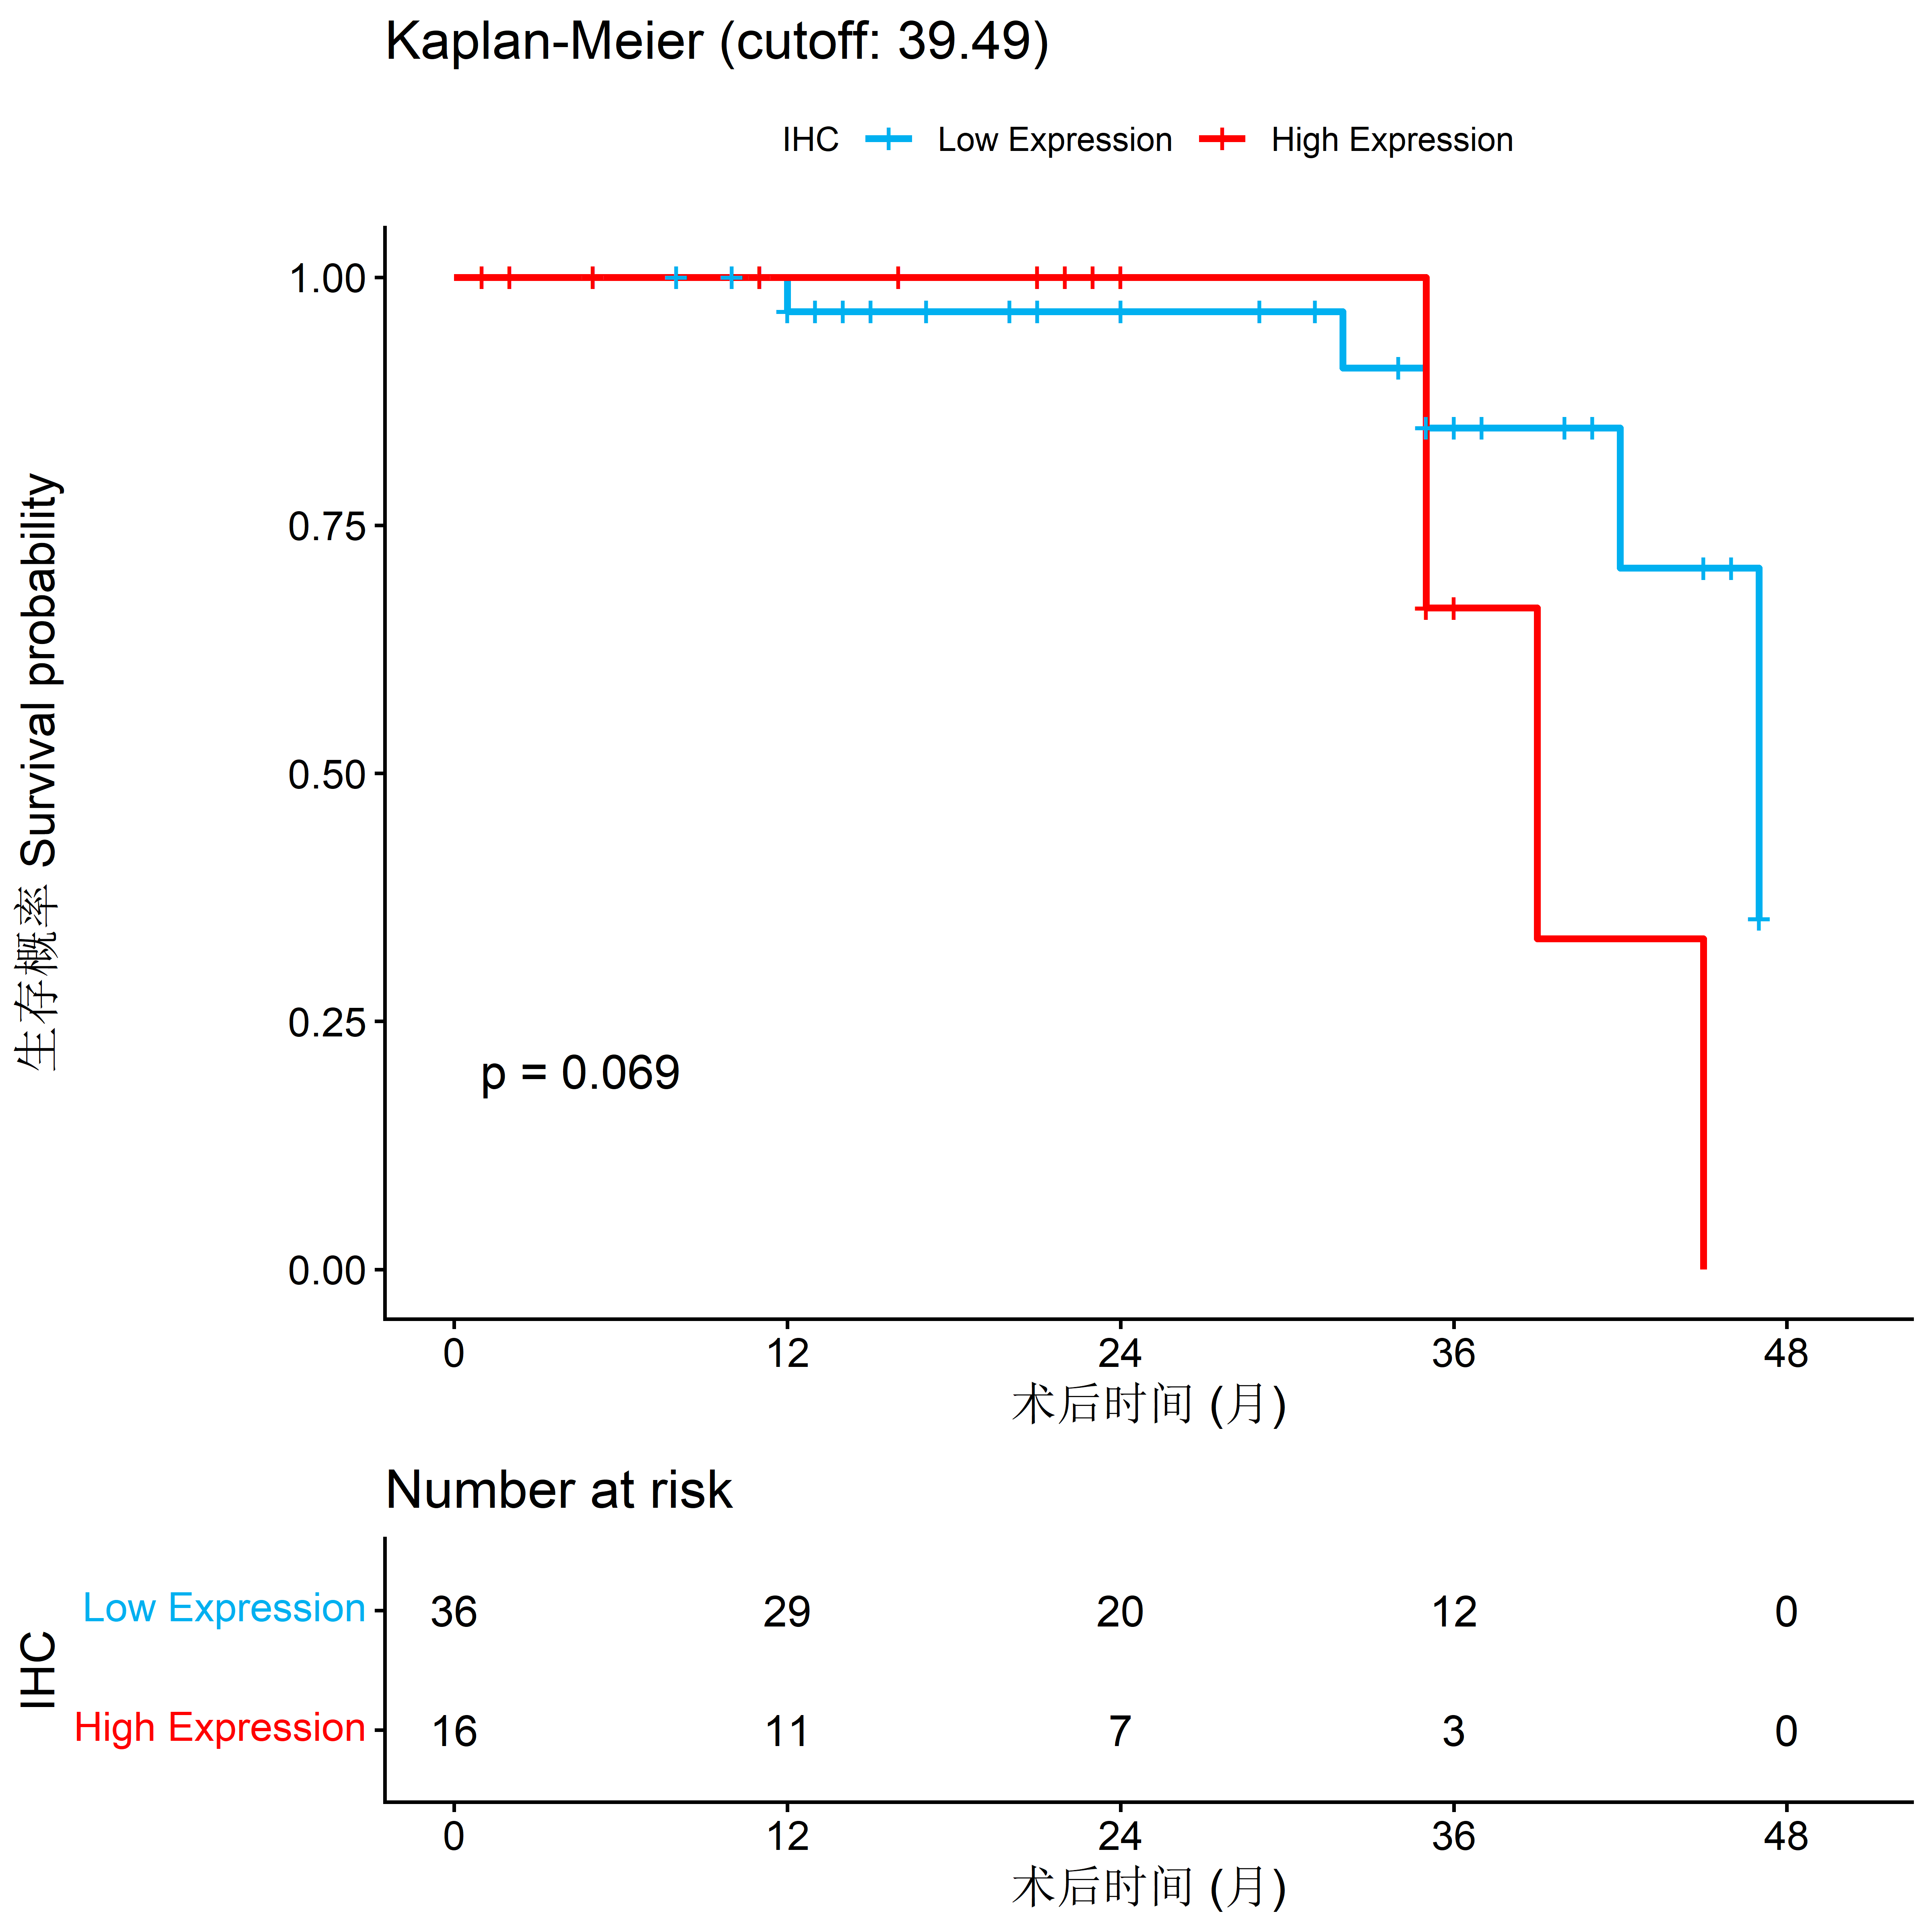
Kaplan-Meier Curve
survival-curve · optimal cutoff + log-rank + number-at-risk table.
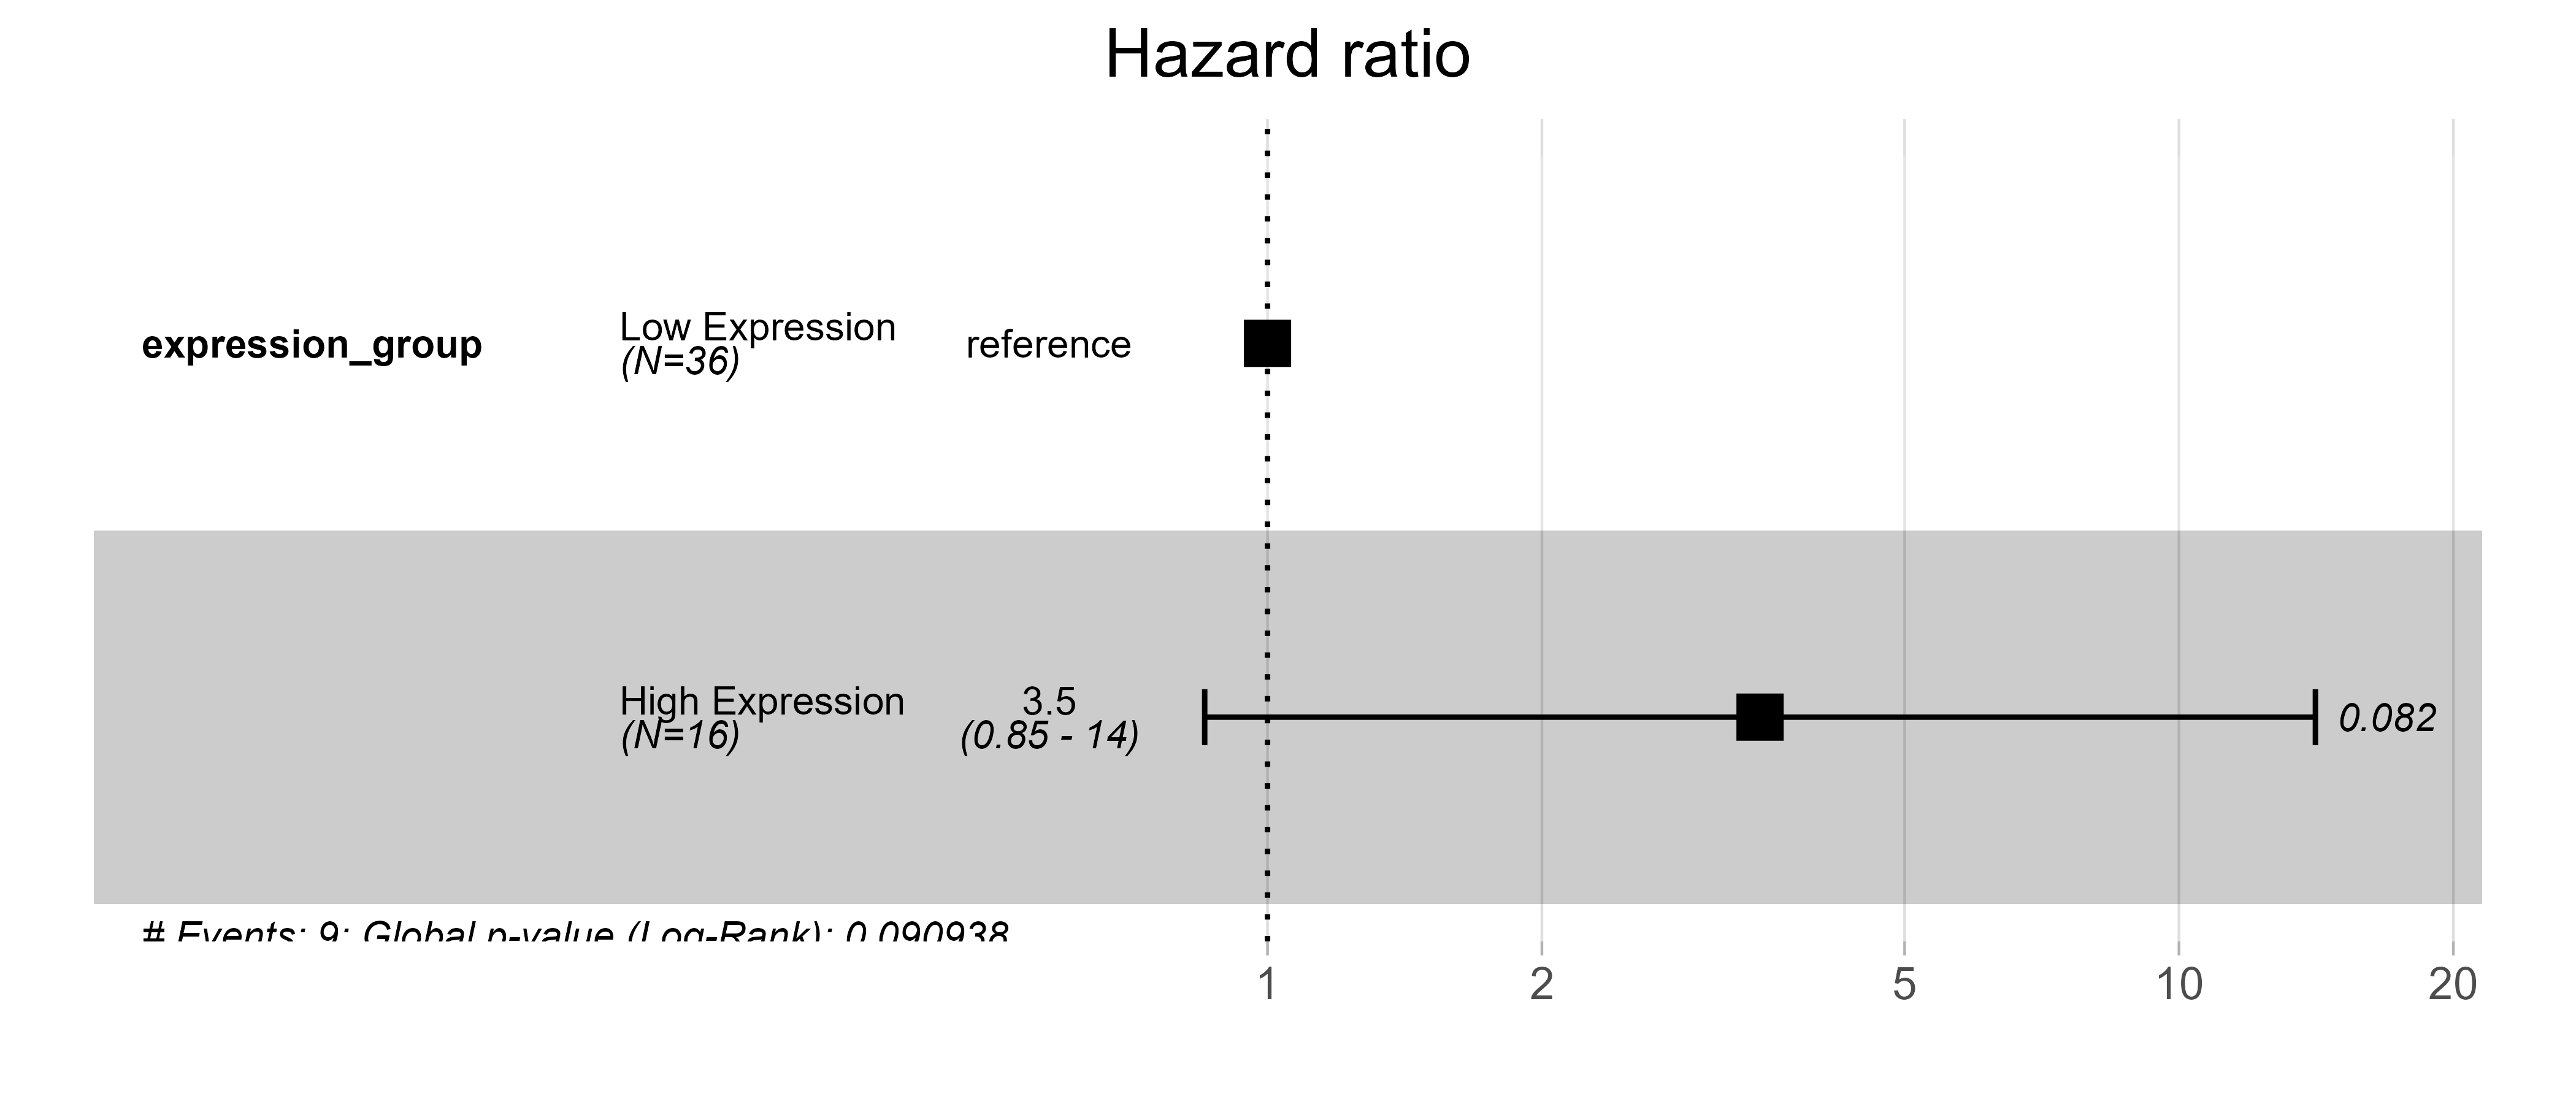
Cox Forest Plot
survival-curve · univariate Cox HR with 95% CI.