
Zero-Basics — GSEA Enrichment Analysis with an AI Agent (RNA-seq-GSEA) | Copy & Paste All the Way
This tutorial uses workbuddy as the AI agent and Hy3 as the AI API. For installing and configuring the AI agent itself, see the AI Agent setup tutorial.
Before you start (must read):
- If this is your first time doing bioinformatics with an AI agent, we strongly recommend following the bulk-RNA-seq differential analysis tutorial first, to learn the full "install skill → set up environment → run example → switch to your own data" workflow, then come back to this skill.
- This skill is a downstream skill of bulk-RNA-seq: it consumes the
DEG_*.csvdifferential-expression tables produced by the bulk-RNA-seq pipeline. Please finish the bulk-RNA-seq tutorial and keep its output folder. - In one sentence: enrichment without thresholds, using the full ranked gene list — fgsea against MSigDB-format GMT gene sets, with a built-in Reactome demo gene set that works out of the box.
- Two important reminders:
- MSigDB gene set files (.gmt) must be downloaded by you from the MSigDB website after registration (licensing — the skill cannot redistribute them); after downloading, copy them into the skill's
resources/gmt/folder. (The built-in reactome_demo_mmu.gmt works without any download.) - The MSigDB mouse C2 collection contains no KEGG gene sets — for KEGG, use the RNA-seq-enrichment skill instead.
- MSigDB gene set files (.gmt) must be downloaded by you from the MSigDB website after registration (licensing — the skill cannot redistribute them); after downloading, copy them into the skill's
Tutorial structure:
- Step 1 | Install the RNA-seq-GSEA skill (one time only)
- Step 2 | Set up the runtime environment (one time only)
- Step 3 | Run the bundled example data
- Step 4 | Switch to your own data
- Step 5 | Read the REPORT.md
- More analysis | Related downstream skills (enrichment / gene-expression barplot)
Step 1 | Install the RNA-seq-GSEA skill
Paste this prompt:
Please install the "RNA-seq-GSEA" skill for me, into the D:\claw2bio folder:
1. Create a folder named claw2bio in the root of the D: drive (if it doesn't exist yet).
2. From the GitHub repository https://github.com/nihuanhe/claw2bio, fetch ONLY the folder
   bioinformatics/bulk_RNA_seq/RNA-seq-GSEA (use sparse checkout — do NOT clone the whole
   repository), and place it at D:\claw2bio\RNA-seq-GSEA.
3. If downloading from GitHub fails or is too slow, download the zip from this mirror link instead:
   https://claw2bio.site/downloads/RNA-seq-GSEA.zip
   and extract it to D:\claw2bio\RNA-seq-GSEA.
4. Read the SKILL.md inside, then confirm to me that the skill is ready and list the contents
   of the folder.
(If my PC has no D: drive, install to C:\claw2bio instead and tell me the actual path.)
When Step 1 finishes, open the file manager and confirm that D:\claw2bio\RNA-seq-GSEA exists, with scripts/, examples/, resources/gmt/, SKILL.md, etc. inside.
Step 2 | Set up the runtime environment
If you already installed R (4.5 or above) while following the bulk-RNA-seq tutorial, this step mainly adds fgsea and related R packages. Paste this prompt:
Please set up the runtime environment for the "RNA-seq-GSEA" skill at D:\claw2bio\RNA-seq-GSEA:
1. R should already be installed from the bulk-RNA-seq tutorial — verify that R is installed
   and report its version to me (it must be 4.5 or above). If R is missing, stop and tell me.
2. Install all R packages this skill needs (fgsea and its dependencies): try CRAN / Bioconductor
   online first; if any package fails or is too slow, stop and tell me about it.
3. When everything is installed, run the dependency-check script scripts/00_check_deps.R
   --organism mouse inside the skill folder and show me the result.
When Step 2 finishes, the AI agent will tell you whether all dependency checks passed.
Step 3 | Run the bundled example data
Paste this prompt:
The skill is installed at D:\claw2bio\RNA-seq-GSEA. Please run the bundled example:
1. Example input is at D:\claw2bio\RNA-seq-GSEA\examples\input\DEG_Mutant_vs_Control.csv
2. Use the built-in gene set resources/gmt/reactome_demo_mmu.gmt, with --organism mouse.
3. Write results to D:\claw2bio\RNA-seq-GSEA\examples\output\
4. Prefer the skill's own scripts in scripts/ — do NOT write new analysis code from scratch.
5. When the run succeeds, show me the key result figures: first the top-15 NES dotplot, then
   the enrichment running-score curve of the most significant gene set; then explain the
generated REPORT.md line by line.Note: on Windows, if the run looks "stuck", it is almost certainly NOT frozen — fgsea is forced to run serially in some Windows environments. Just wait patiently.
When the run succeeds, you should see two kinds of plots (examples shown below; replace with your own screenshots later):
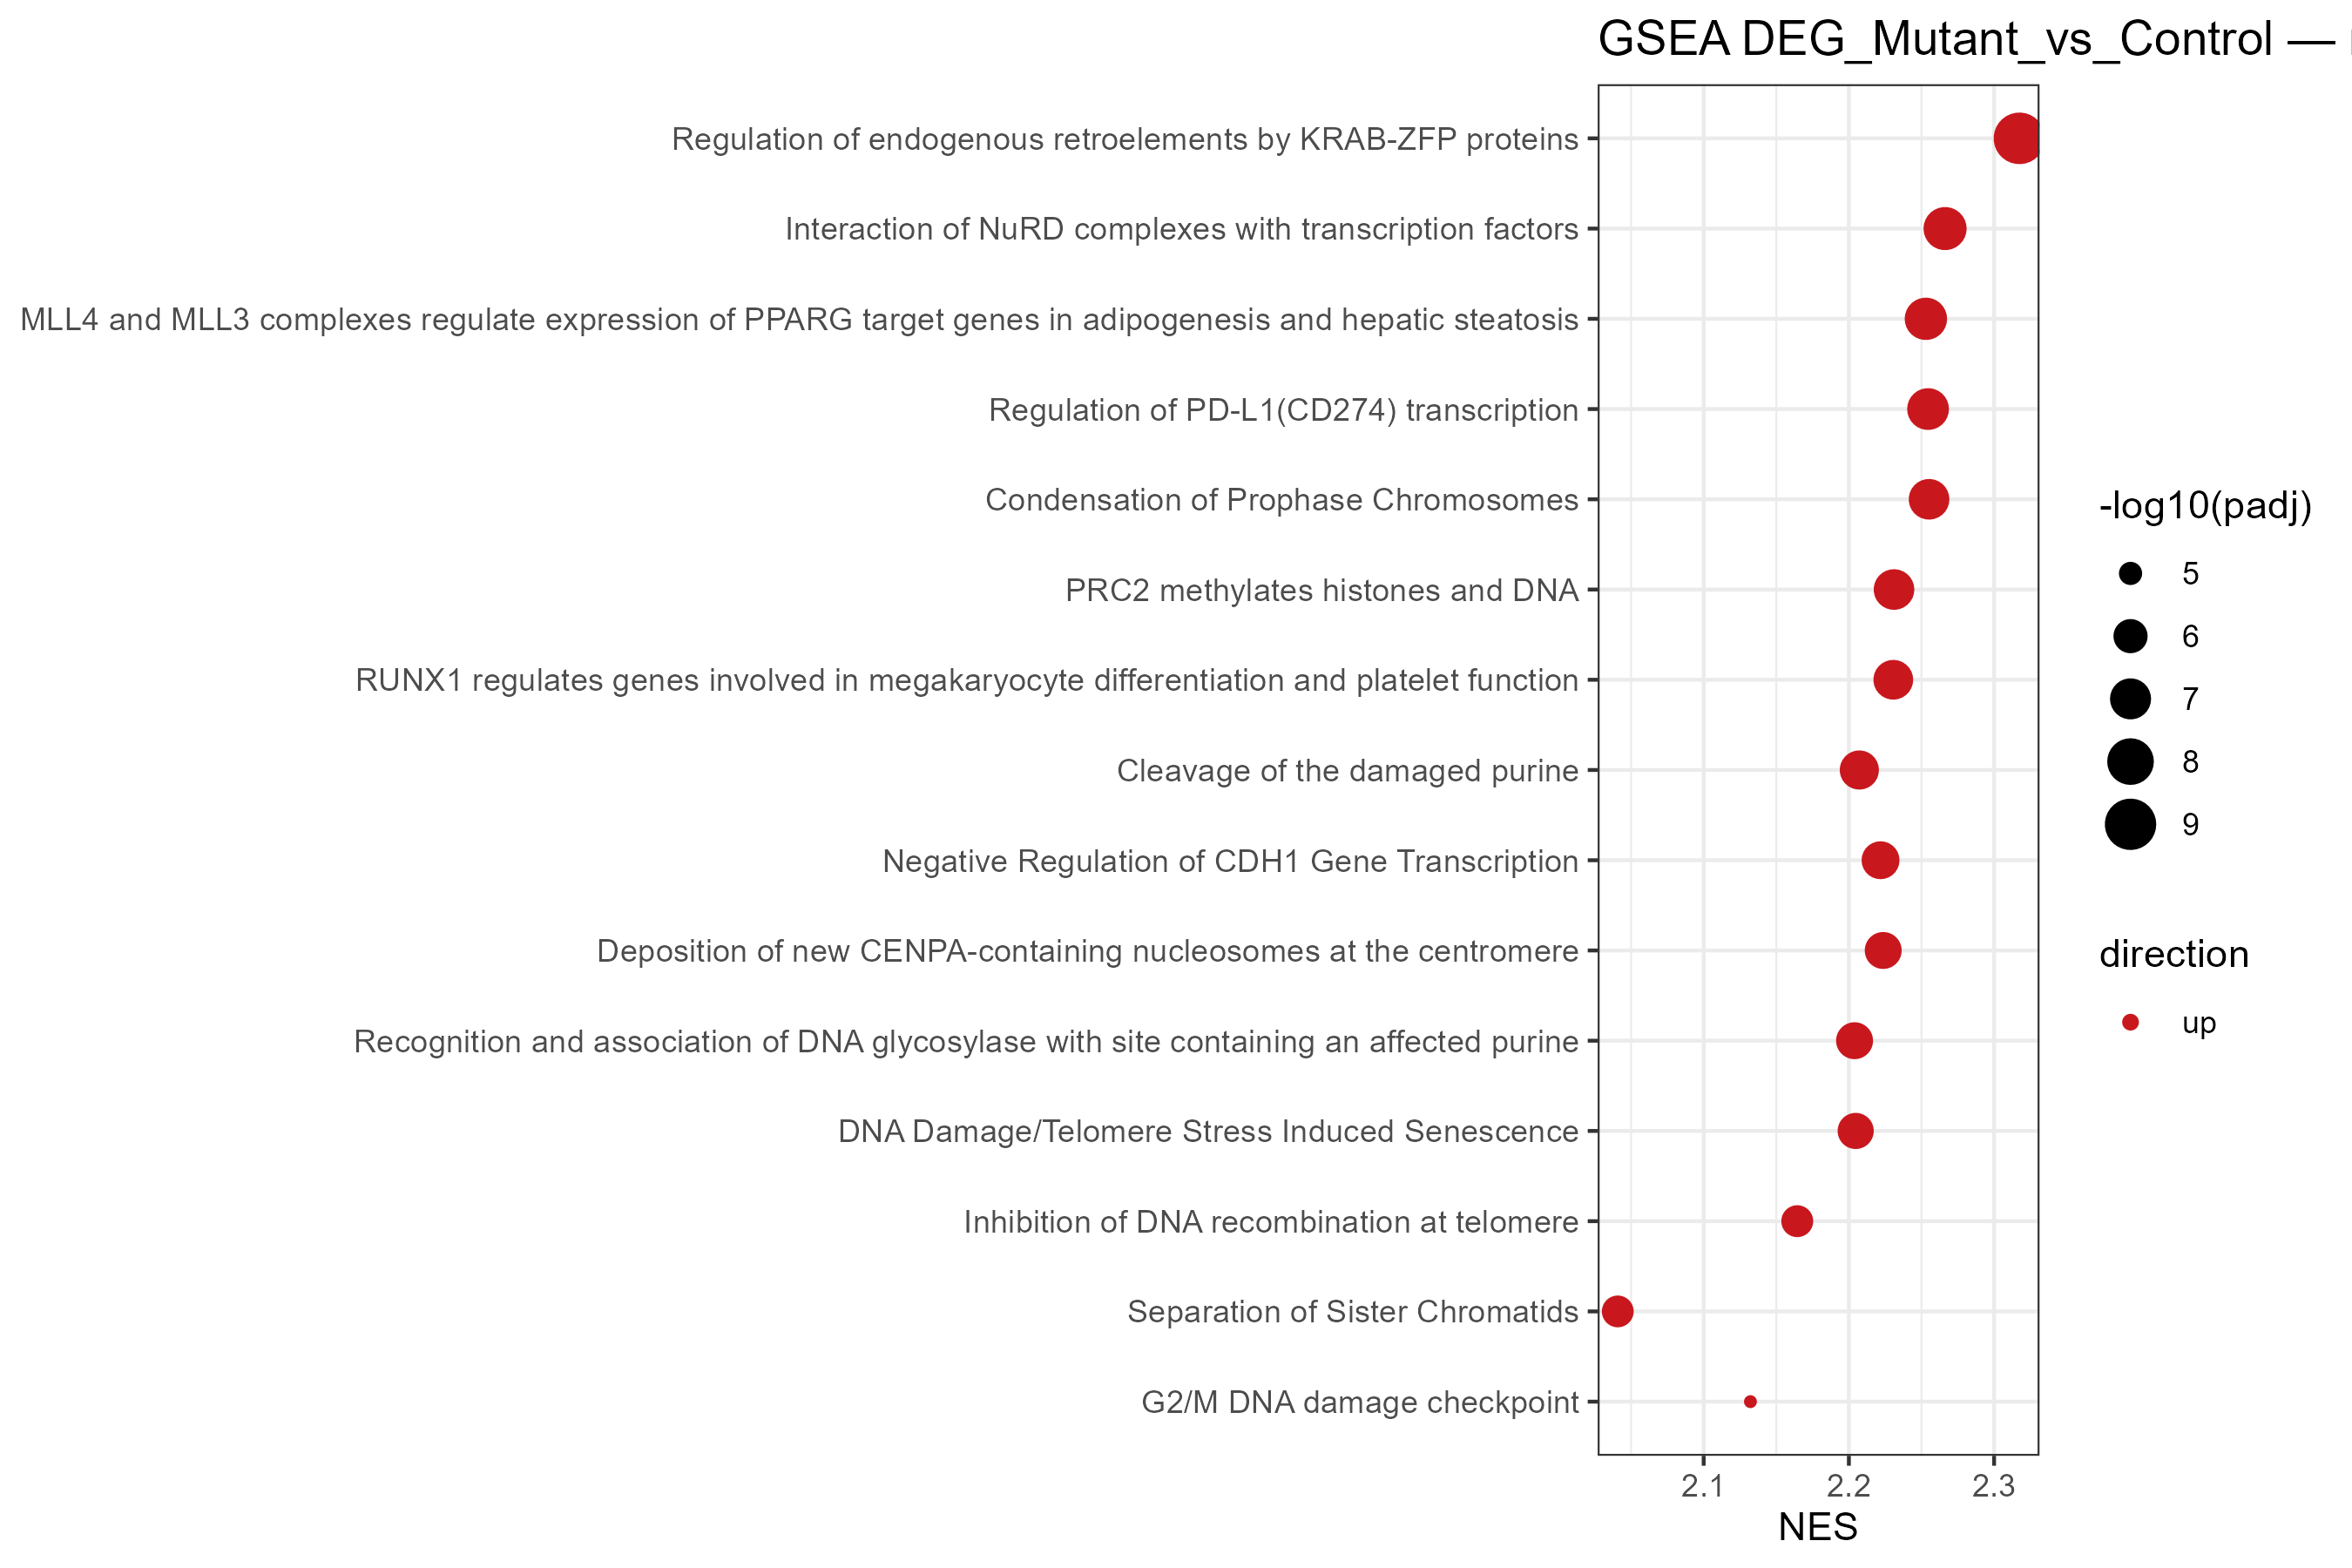
Top-15 gene sets by padj in an NES dotplot (x axis = NES, up-regulated red / down-regulated blue, dot size = -log10(padj)):
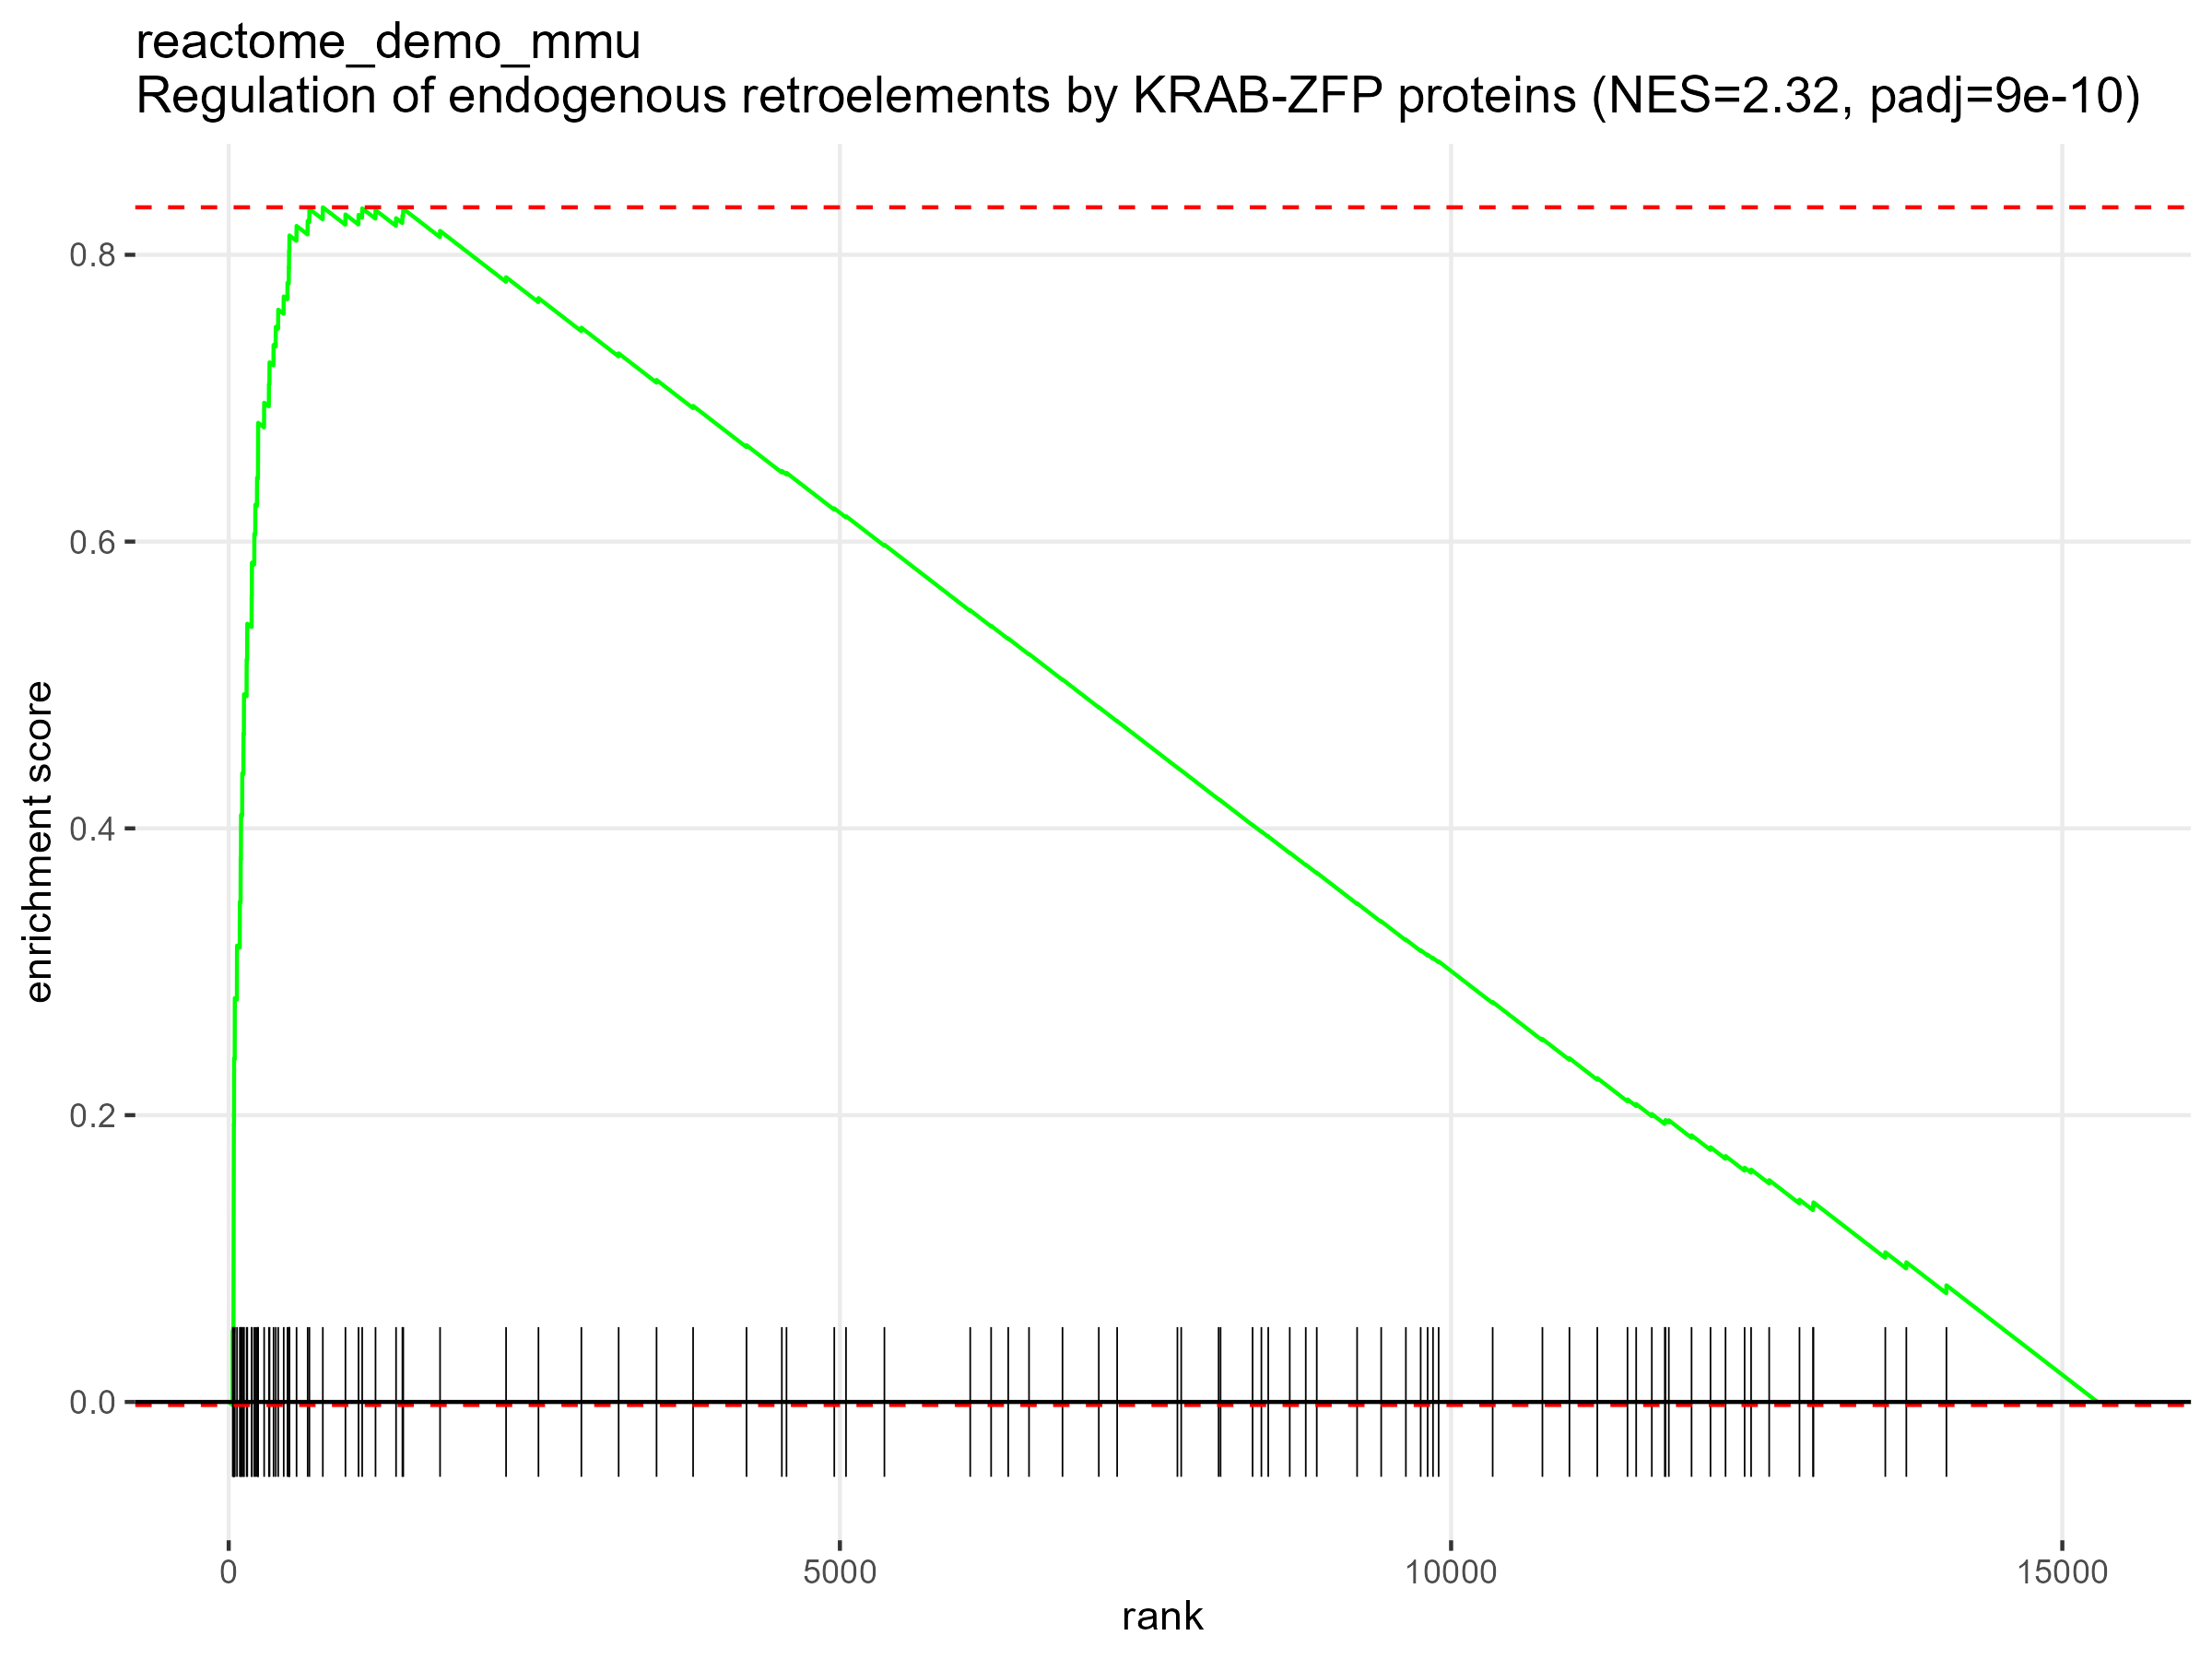
The classic enrichment running-score curve of the most significant gene set:
Step 4 | Switch to your own data
Hand over your own DEG_*.csv from the bulk-RNA-seq pipeline. If you want to use your own MSigDB gene sets, first tell the AI that you copied the .gmt files into resources/gmt/. Paste this prompt:
My own differential-expression result is at: <paste the path to your DEG_*.csv file here>.
My organism is <mouse / human> — use the matching --organism setting.
1. First check whether my DEG table has any format problems (required columns: gene, log2fc,
   pvalue, padj); if so, fix them and tell me what you did.
2. <Choose ONE: Use the built-in reactome_demo_mmu.gmt gene set. / I have copied my own MSigDB
   .gmt files into D:\claw2bio\RNA-seq-GSEA\resources\gmt\ — use ALL .gmt files in that folder.>
3. Run the GSEA pipeline and write results to an output folder next to my data, then show me
   the NES dotplot and the top enrichment curve for each gene set.
4. Prefer the skill's own scripts in scripts/; if anything needs adapting, make the smallest
   possible change — do NOT write large amounts of new code.
5. Reminder: do NOT try to find KEGG gene sets in MSigDB — they are not there. If I ask for
   KEGG, tell me to use the RNA-seq-enrichment skill instead.
Wait for the AI agent to finish: each GMT gene set produces a result table (pathway, NES, pvalue, padj, leadingEdge), a top-15 NES dotplot, and an enrichment curve of the most significant gene set.
Step 5 | Read the REPORT.md
Ask the AI to interpret your results:
Please explain the REPORT.md in my GSEA results folder line by line:
1. What each output file is and what it contains (the result CSV, the NES dotplot, the top
   enrichment curve);
2. Which gene sets are significantly enriched at padj < 0.05, split into up-regulated
   (positive NES) and down-regulated (negative NES);
3. Explain what NES and leadingEdge mean in plain language, and point out the top 3 most
   interesting gene sets for my comparison;
4. Any warnings or things I should pay attention to.
After explaining, tell me which figures and tables can be used directly in a paper or
presentation.
After reading the AI's explanation, if anything is unclear, just ask it directly.
More analysis
This skill only does GSEA. The two skills below are sibling downstream skills, installed in exactly the same way (one-click prompt or zip download from the website), and both consume the bulk-RNA-seq output:
Enrichment analysis (GO / KEGG / Reactome) — RNA-seq-enrichment
One sentence: DEG tables in, GO / KEGG / Reactome enrichment tables and dotplots out. Threshold-based enrichment (up/down separately) — the right choice for KEGG enrichment (MSigDB has no KEGG gene sets).
Details & download: /skills/RNA-seq-enrichment
Gene-expression barplot — RNA-seq-gene-plot
One sentence: pull a single gene out of the normalized matrix and plot it. Ideal for taking the leading-edge key genes from your GSEA results and plotting publication-grade barplots gene by gene.
Details & download: /skills/RNA-seq-gene-plot